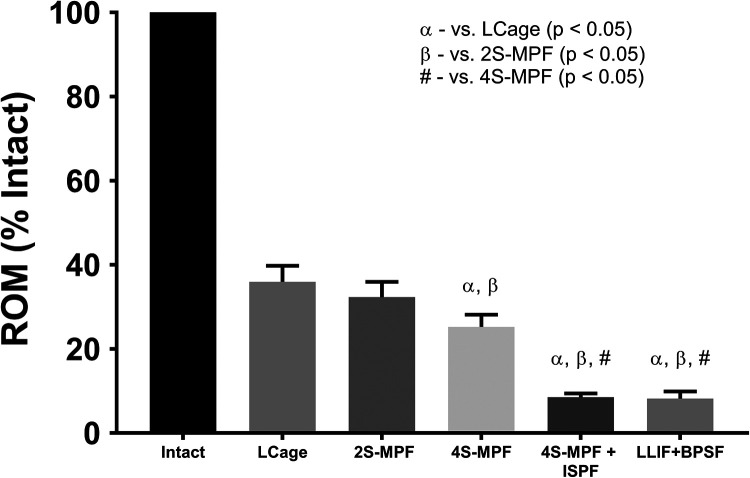
Figure 6.
Mean range of motion (ROM), relative to intact conditions, when loaded in flexion-extension under a pure moment of 7.5 Nċm. Bars represent the mean and error bars are standard deviation. Symbols denote significant differences (P < .05) between groups according to a repeated-measures analysis of variance with Bonferonni’s correction for multiple comparisons.

