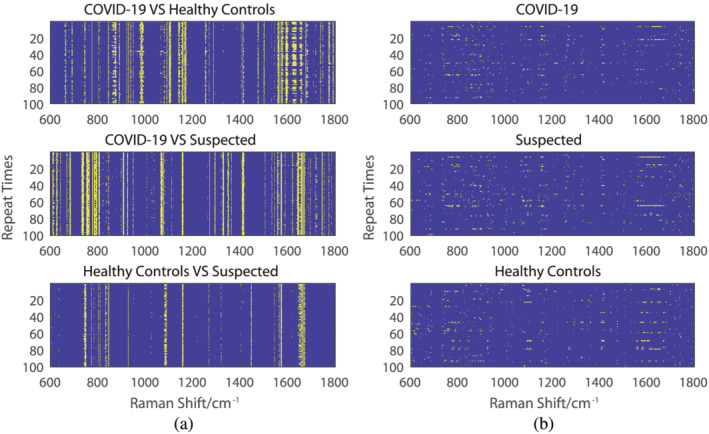
FIGURE 2.

The result of the ANOVA test. The spectra range without a significant difference in the ANOVA test (p < 0.05) was indicated in blue, while others were indicated in yellow. (a) The Raman shift spectrum of the difference in p value after a 70% random sampling and repeated training 100 times for the intergroups. (b) The Raman shift spectrum of the difference in p value after a 70% random sampling and repeated training 100 times intragroups [Colour figure can be viewed at wileyonlinelibrary.com]
