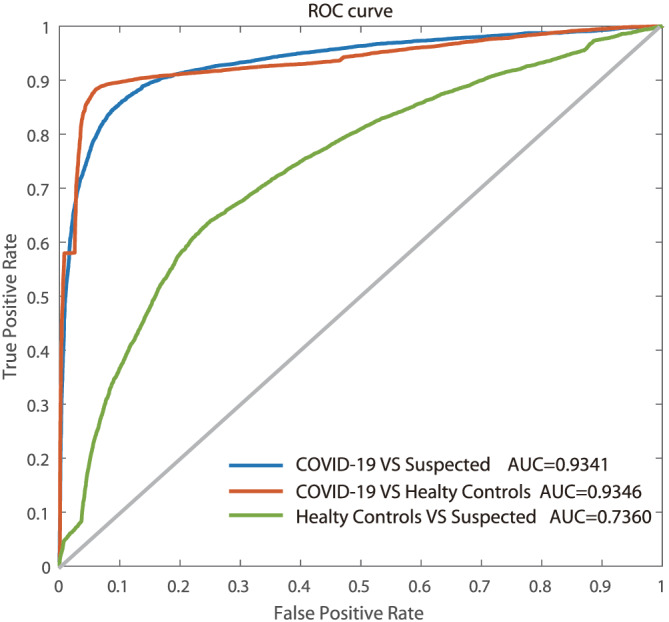
FIGURE 3.

The ROC curve of the SVM diagnostic algorithm for the COVID‐19 group versus the suspected group, the COVID‐19 group versus healthy control group, and the suspected group versus the healthy control group [Colour figure can be viewed at wileyonlinelibrary.com]
