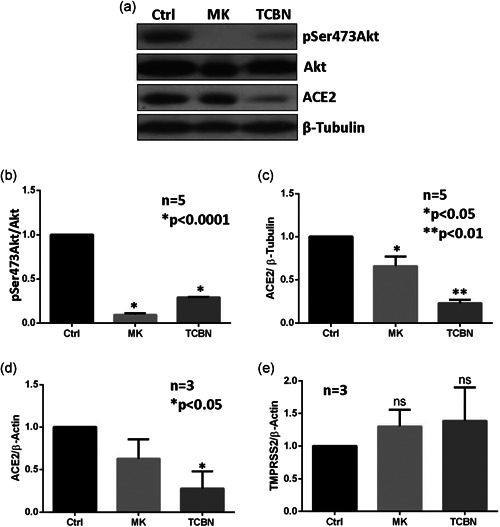
Figure 1.

Treatment with TCBN suppresses ACE2 expression in A549 cells. (a)–(c) Western blot images and bar graphs of band densitometry analysis of MK2206 (MK) and TCBN‐treated A549 cell lysates, indicating changes in the expressions of ACE2, phosphorylated (Ser‐473) Akt, and total Akt normalized to β‐tubulin expression, respectively. (d) and (e) Bar graphs showing changes in the mRNA expression of ACE2 and TMPRSS2 normalized to the β‐actin expression on MK2206 and TCBN‐treated A549 cells compared to the vehicle‐treated (PBS) control. Data are shown as mean ± SEM. ACE2, angiotensin‐converting enzyme 2; mRNA, messenger RNA; PBS, phosphate‐buffered saline; SEM, standard error of mean; TCBN, triciribine
