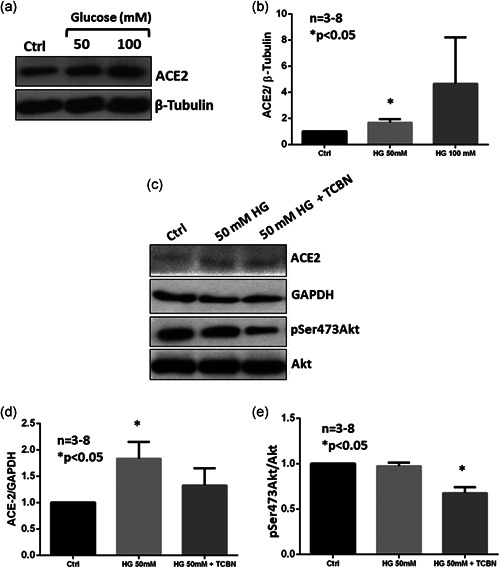
Figure 4.

Akt inhibition blunts hyperglycemia‐induced increase in ACE2 expression in H441 cells. (a) and (b) Western blot images and bar graphs of band densitometry analysis of hyperglycemia (HG) (50 mM or 100 mM glucose) induced expression changes in ACE2 in H441 cells. (c)–(e) Western blot images and bar graphs of band densitometry analysis of 50 mM glucose‐induced changes in ACE2 phosphorylated Akt expression in H441 cells, respectively. Data are shown as mean ± SEM. ACE2, angiotensin‐converting enzyme 2; SEM, standard error of mean; TCBN, triciribine
