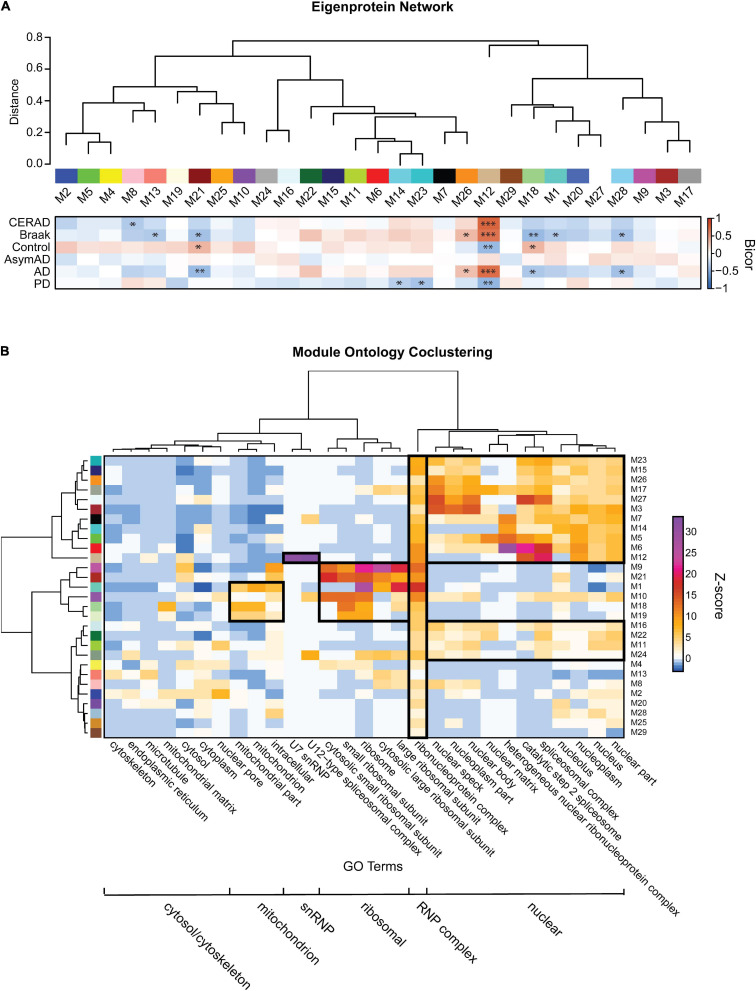
FIGURE 4.
Detergent-insoluble protein co-abundance network and ontology clusters. (A) 29 RBP modules were obtained by WGCNA network analysis. Modules were visualized in relatedness order, with the heatmap shown representing robust bicor correlation of each module to CERAD/Braak scores or each disease diagnoses. Bicor correlations are illustrated as a directional heatmap with a color scale and asterisks to display significance (∗p < 0.05, ∗∗p < 0.01, and ∗∗∗p < 0.001). Correlations between each module was shown by eigenprotein network indicated on the top. (B) For each module, a Z-score for Gene Ontology (GO) terms was calculated which reflects the over-representation of the components of that module to each GO term. Six “clusters” of RBP modules were grouped according to their over-representation of GO-terms involved in mitochondrion, snRNP, ribosomal, RNP, nuclear and cytoplasmic complexes.

