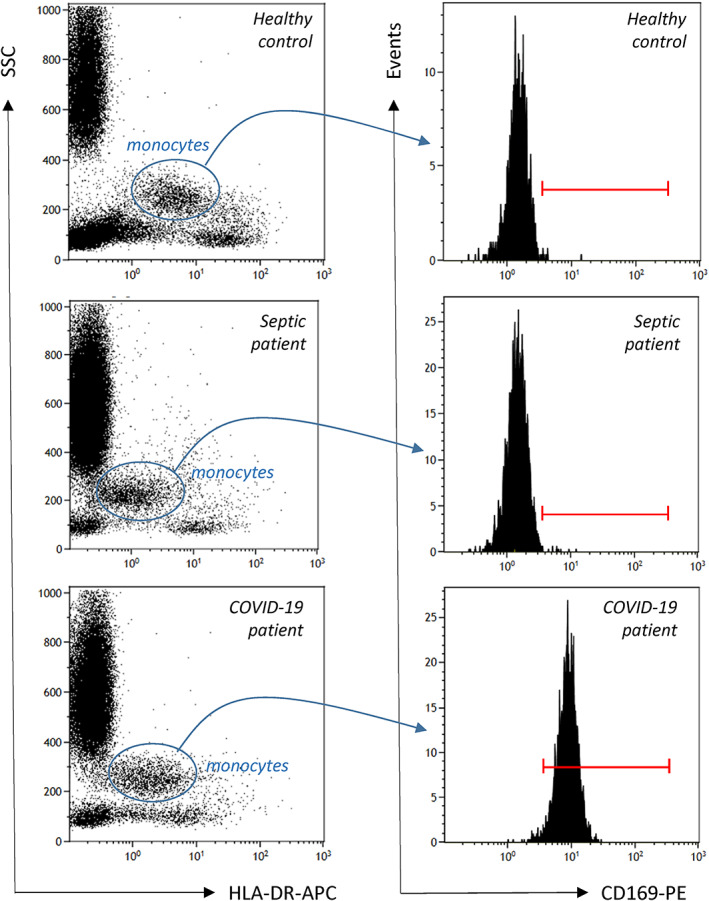
FIGURE 1.

Gating strategy (illustrative examples). Monocytes are first gated out from other cells on the basis of on SSC (side‐scatter) / HLA‐DR histogram (blue circle, left histogram) and CD169 is then measured on their surface (monoparametric histogram, right panel) as mean of fluorescence related to the entire monocyte population or as % of positive cells (positivity threshold, red cursor, was based on lack of CD169 expression on neutrophils). In addition, CD169 MFI was also determined on total lymphocyte population gated on SSC / FSC (forward‐scatter) histogram (not shown) in order to provide results CD169 ratio (i.e., mCD169 MFI/lymphocyte CD169 MFI). One illustrative example of each group is depicted (healthy controls, septic shock, COVID‐19) [Color figure can be viewed at wileyonlinelibrary.com]
