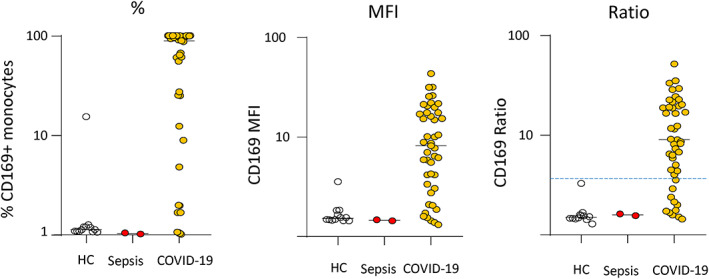
FIGURE 2.

Monocyte CD169 expression in COVID‐19 ICU patients. Results are presented as percentages of positive cells (out of total monocyte population, left graph), median of fluorescence intensity in total monocyte population (MFI, middle graph), ratio monocyte CD169 MFI/lymphocyte CD169 MFI (right graph). The blue dashed line represents threshold proposed in Reference 6. Healthy controls (n = 8) are depicted by empty circles, septic shock patients (n = 2) are depicted by red circles and COVID‐19 ICU patients (n = 45) are depicted by orange circles [Color figure can be viewed at wileyonlinelibrary.com]
