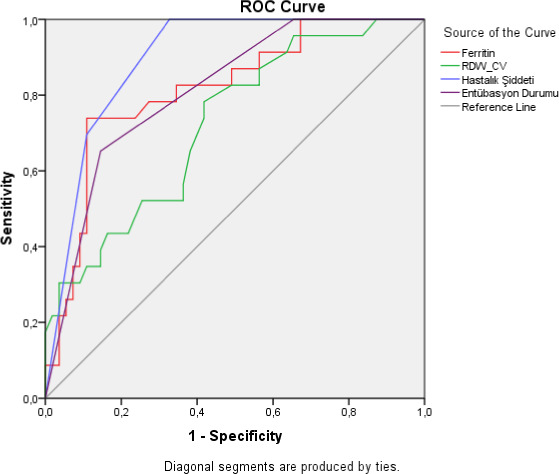
FIGURE 1.

Evaluation of the relationship of the survival status of the patients with the measured parameters and the sensitivity and specificity of these values, by ROC curve

Evaluation of the relationship of the survival status of the patients with the measured parameters and the sensitivity and specificity of these values, by ROC curve