
Fig. 1.
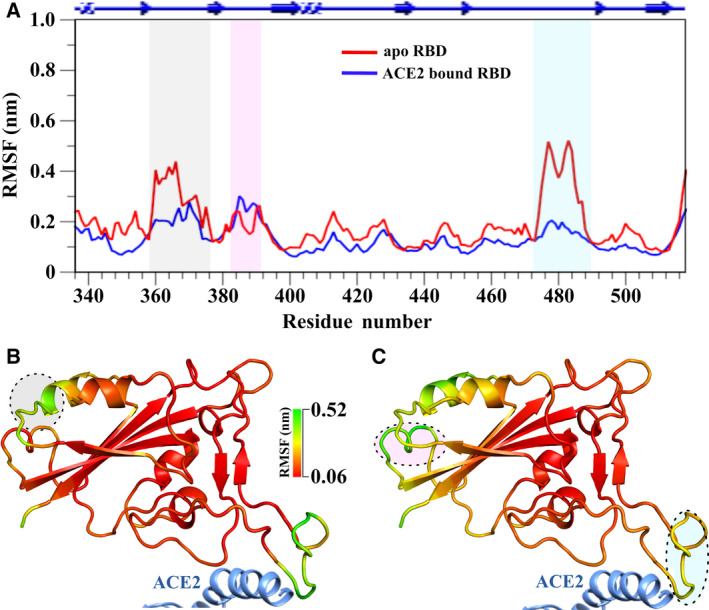
Comparison of Cα atom dynamics. (A) Residue‐wise Cα atom RMSF for both free and ACE2‐bound RBD of SARS‐CoV‐2. Significant changes (above cutoff value of 0.2 nm) were marked with different colored columns. RMSF values were mapped onto the crystal structures (PDB ID: 6M0J) of respective (B) free, and (C) ACE2‐bound RBD. A PyMol spectrum bar‐based color scheme was used to point out differential fluctuating regions of both and is indicated by circles correspond to the same color used for (A).