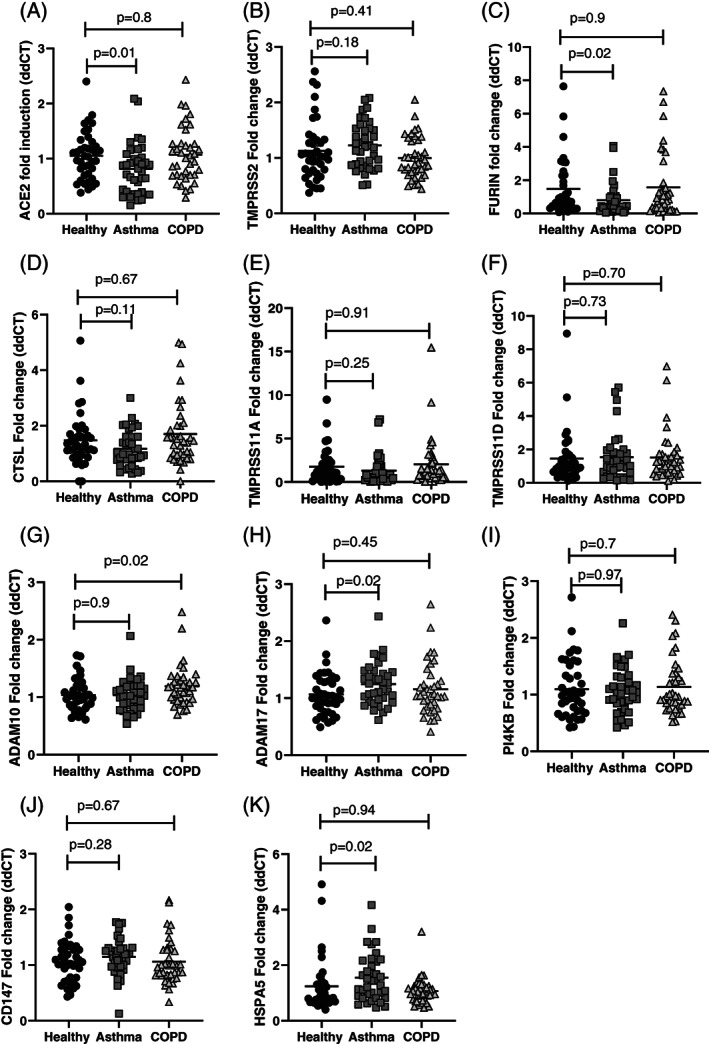
Figure 1.

All values are represented individually. The mean and SD are also presented. Differences between the groups were assessed using one‐way analysis of variance (ANOVA), with Dunnett's multiple comparison test. If the ANOVA was significant (P < 0.05), the P‐values are labelled for the group that is different from the healthy controls.
