Figure 2.

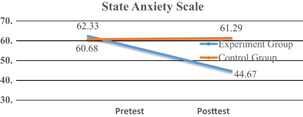
The variation of the mean State Anxiety Scale scores of the experimental and control groups by time of measurement [Color figure can be viewed at wileyonlinelibrary.com]

The variation of the mean State Anxiety Scale scores of the experimental and control groups by time of measurement [Color figure can be viewed at wileyonlinelibrary.com]