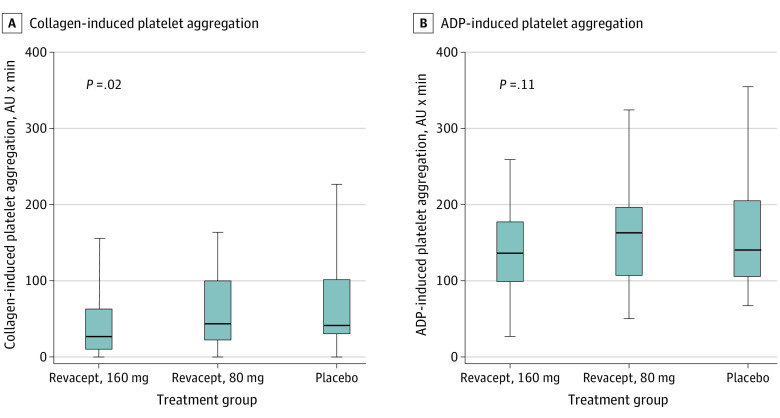
Figure 3. Inhibition of Collagen-Induced Platelet Aggregation (A) and ADP-Induced Platelet Aggregation (B).
Horizontal bars indicate the median values, boxes indicate the 25th and 75th percentiles, and vertical lines indicate the 5th and 95th percentiles. The results are shown for collagen concentration of 253 μg/mL. ADP indicates adenosine 5′-diphosphate; AU, aggregation unit.

