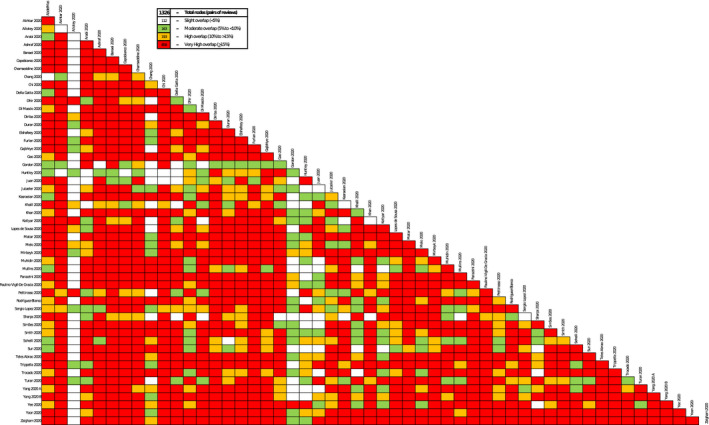
FIGURE 3.

Detailed assessment of corrected covered area. Our overview includes several systematic reviews (SRs), and each SR includes primary studies. It is expected that some primary studies are included in two or more SRs, which is known as “overlap of primary studies”. To assess this overlap, there is a formula known as corrected covered area (CCA), 18 where values below 5% are considered low overlap; between 5% and 10% are considered moderate; between 10% and 15% are considered high; and above 15% are considered very high. Usually overlap is presented as an overall assessment for the whole body of evidence, but this approach sometimes fails to identify which specific SRs are contributing to double‐counting of the same primary studies. In this figure, we present not an overall CCA, but a CCA for each pair of SRs. White boxes represent low overlap (CCA <5%), green boxes represent moderate overlap (CCA between >5% and <10%), yellow boxes represent high overlap (CCA between >10% and <15%), and red boxes represent very high overlap (CCA ≥ 15%). The interpretation of each one of these boxes or “nodes” involves two SRs: a white node means that there are none or a minimum proportion of primary studies shared by the two SRs assessed, whereas a red node means that there is a considerable amount of primary studies shared by the pair of SRs assessed
