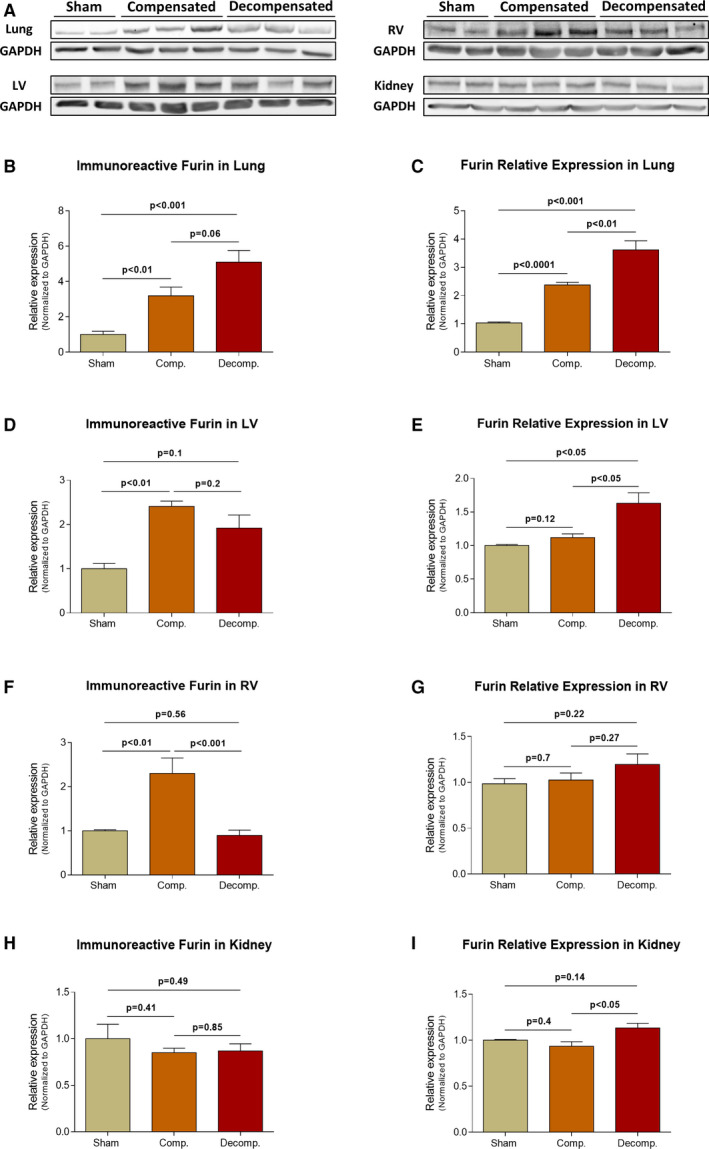
Figure 3.

Immunoreactive levels and expression of furin in the lungs, LV, RV and kidneys of compensated, decompensated CHF and sham controls as were determined with western blots analysis and RT‐qPCR. A, Representative western blot analysis of tissue lysates with antibody for furin. Western blot analysis quantification of furin in the lungs, LV, RV and kidneys (B, D, F and H, respectively) of sham, compensated CHF and decompensated CHF (n = 3‐11), where GAPDH was used as loading control. Quantification of RT‐qPCR analysis for furin mRNA normalized to GAPDH are depicted in C, E, G and I. Values are means ± SEM
