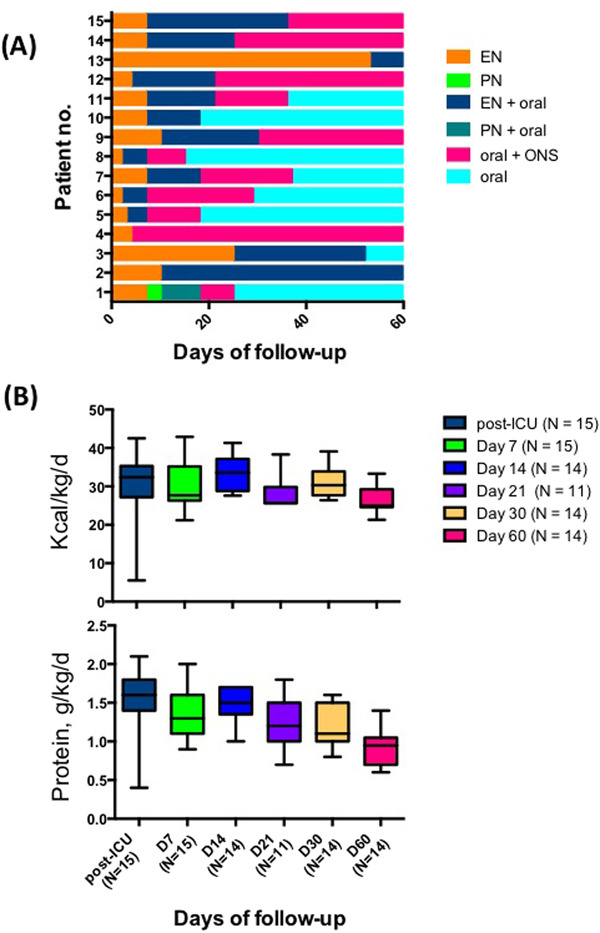
Figure 3.

Nutrition support for individual patients and nutrition intake (energy and protein) during the 2 months of follow‐up. (A) Representative nutrition support of the 15 patients and their duration (in days). Each support is represented with a different shade of gray. One patient was lost to follow‐up at day 30. (B) Each plot represented the median of kcal/kg/d and g/kg/d protein at the time to the follow‐up. D, day; ICU, intensive care unit; no., number
