
Figure 1.
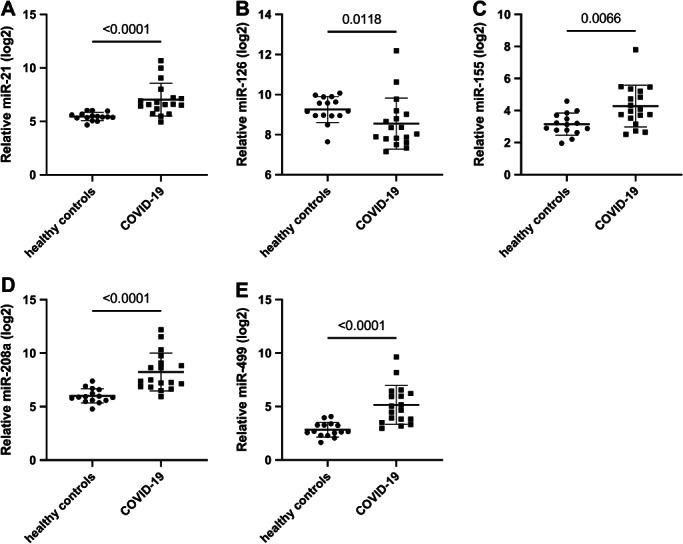
Levels of the indicated microRNAs (miRs) in healthy controls and COVID‐19 patients. Data are presented as dot plots and mean ± standard deviation. Mann–Whitney test was used for statistical comparison.
Official websites use .gov
A
.gov website belongs to an official
government organization in the United States.
Secure .gov websites use HTTPS
A lock (
) or https:// means you've safely
connected to the .gov website. Share sensitive
information only on official, secure websites.
Levels of the indicated microRNAs (miRs) in healthy controls and COVID‐19 patients. Data are presented as dot plots and mean ± standard deviation. Mann–Whitney test was used for statistical comparison.