
FIGURE 1.
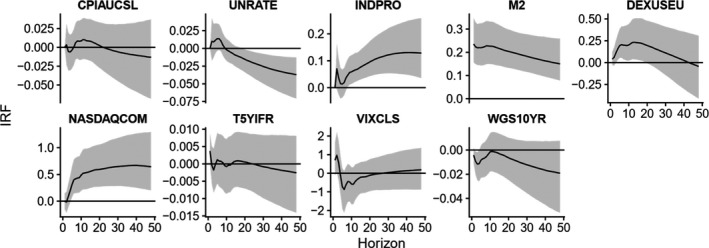
Impulse response functions to a one‐standard deviation shock to M2. Notes: Median response alongside the 90 percent posterior credible set. The black horizontal line marks zero
Official websites use .gov
A
.gov website belongs to an official
government organization in the United States.
Secure .gov websites use HTTPS
A lock (
) or https:// means you've safely
connected to the .gov website. Share sensitive
information only on official, secure websites.
Impulse response functions to a one‐standard deviation shock to M2. Notes: Median response alongside the 90 percent posterior credible set. The black horizontal line marks zero