
FIGURE 1.
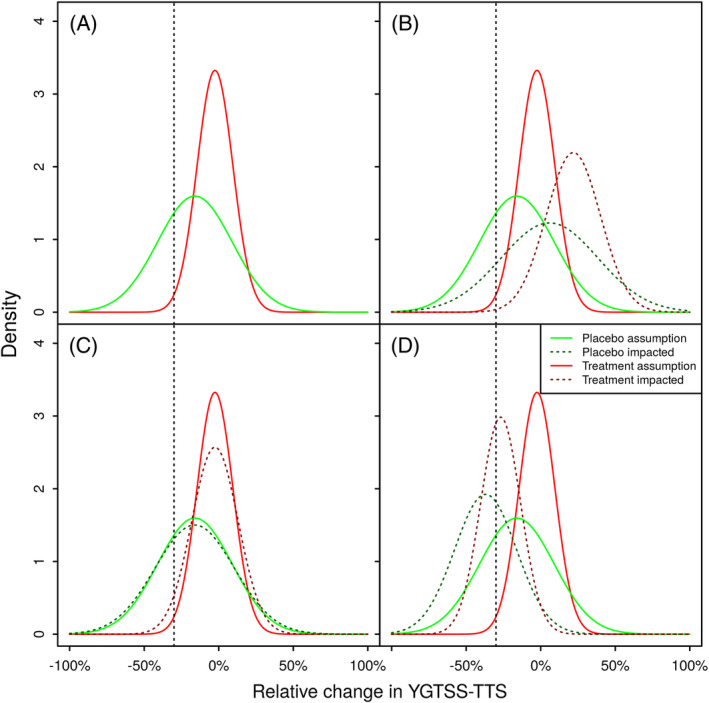
Potential impacts of the intercurrent event on the distribution of relative change in YGTSS‐TTS from 13 weeks. Panel (A) depicts the planning assumptions for the relative change in YGTSS‐TTS, corresponding expected response rates are 1% for the Placebo group and 29% for the Treatment group. Panel (B) exemplifies scenario (i) leading to an increase at the YGTSS‐TTS at the second visit, and a decrease in the expected response rates to 0% for the Placebo group and 14% for the Treatment group. Panel (C) exemplifies scenario (ii) introducing additional variability, but not changing the expected YGTSS‐TTS. Due to in increased variability, the expected response rates increase to 4% for the Placebo group and 30% for the Treatment group. Panel (D) exemplifies scenario (iii) leading to a decrease of the YGTSS‐TTS at the second visit, and an increase in the expected response rates to 41% for the Placebo group and 62% for the Treatment group