
Figure 3.
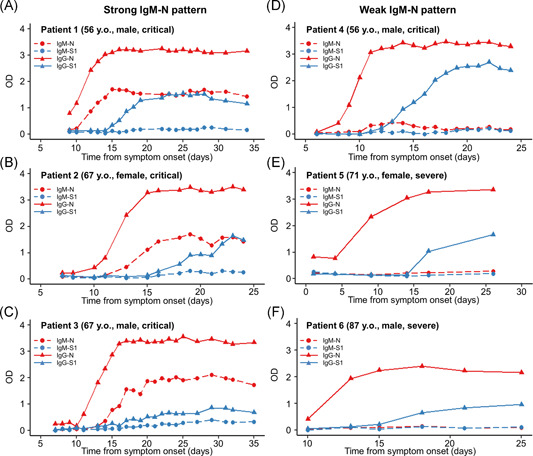
Antibody response patterns in severe and critical cases in six representative patients. The representative cases selected were serially collected samples from early symptom onset to convalescence in each group. Strong IgM‐N patterns (A–C) and weak IgM‐N patterns (D–F). Red, N protein; blue, S1 protein; dashed line and circle plots, IgM antibody assay; and solid line and triangle plots, IgG antibody. Ig, immunoglobulin; N, nucleocapsid protein; OD, optical density; S1, spike 1 protein