
Figure 2.
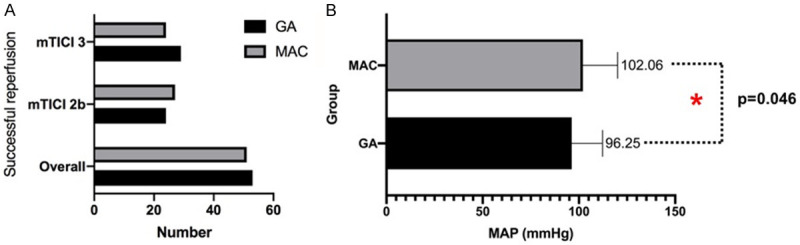
Bar graphs comparing the rates. A: Successful reperfusion after ET; B: Intraoperative mean arterial pressure for the GA (black) vs. MAC (gray) groups. GA: general anesthesia; MAC: monitored anesthesia care; mTICI: modified Thrombolysis in Cerebral Ischemia. * indicates that there was a statistical difference between two groups with P=0.046.