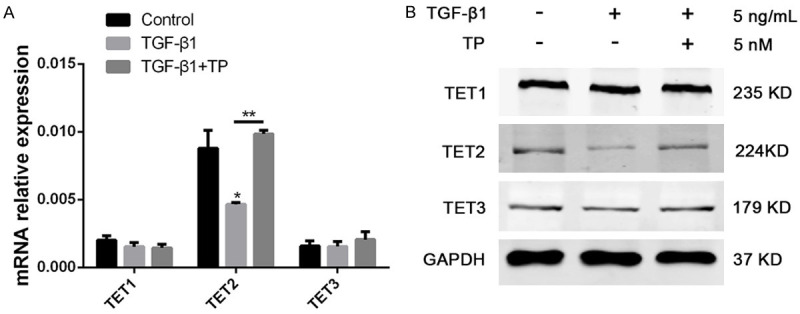
Figure 2.

Effect of TP on the expression of TET1-3. A. The relative mRNA levels of TET1, TET2, and TET3 in the podocytes with different treatments. Three independent experiments were analyzed. Quantitative data are provided as means ± SD. **P < 0.01. B. Protein levels of TET1, TET2, and TET3 in podocytes with different treatments.
