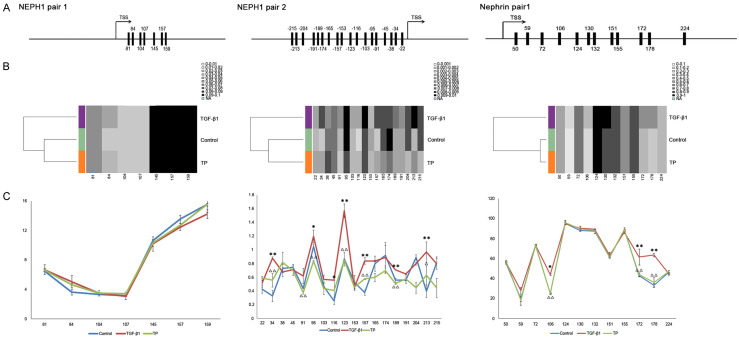
Figure 3.
Site-specific 5mC status in the promoters of NEPH1 and nephrin. A. Sequence information of CpG in NEPH1 and nephrin promoters. TSS: transcriptional start site. B. Methylation levels of NEPH1 and nephrin were analyzed via BSAS. Dendrograms showing the unsupervised clustering of the data are presented using Methylation plotter, a web tool for dynamic visualization of DNA methylation data. The different groups are highlighted with different colors. C. Methylation percentages of individual CpG sites in the promoters of NEPH1 and nephrin. *P < 0.05 vs. TGF-β1 group. **P < 0.01 vs. TGF-β1 group. ΔP < 0.05 TP group vs. TGF-β1 group. ΔΔP < 0.01 TP group vs. TGF-β1 group.

