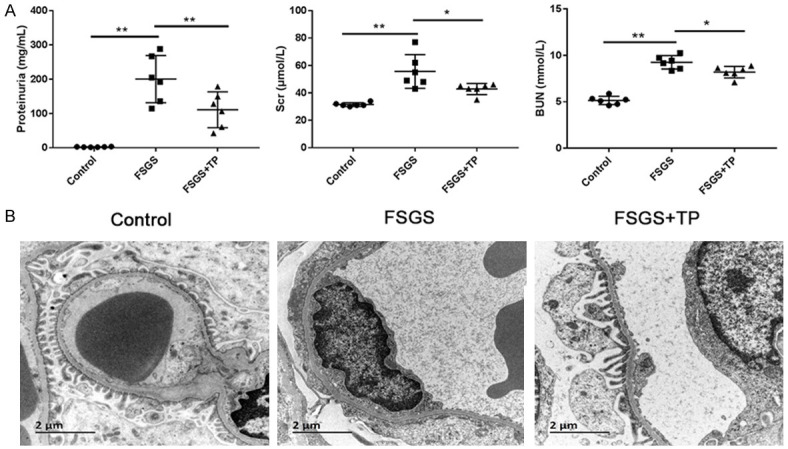
Figure 6.

Evaluation of the FSGS rat model. A. Levels of proteinuria (mg/mL), Scr (μmol/L), and BUN (mmol/L) from different groups of rats. Data (n = 6) are presented as mean ± SD. *P < 0.05; **P < 0.01. B. Analysis of podocyte injury by TEM. Representative micrographs in each group are shown. Scale bar 2 μm (bottom left). Original magnification × 10,000, n = 6 animals in each group.
