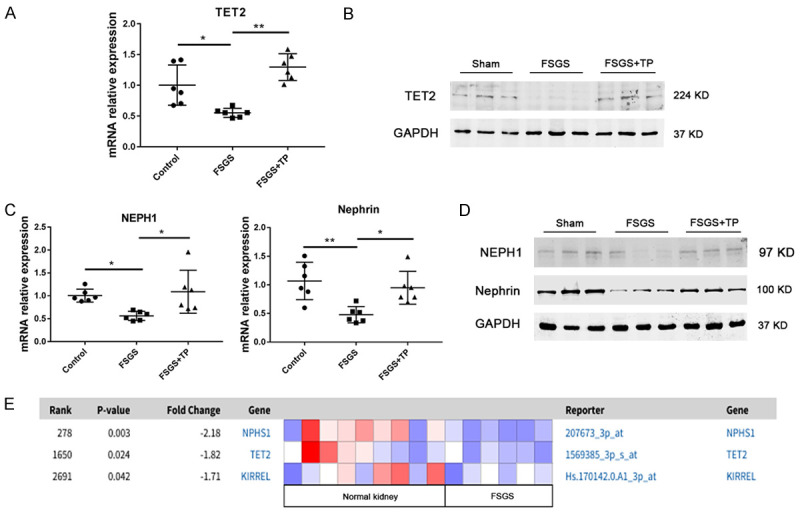
Figure 7.

Effect of TET2 in protecting the podocyte injury in the FSGS rat model. A. Relative mRNA levels of TET2 in the rat kidney tissues were detected by qRT-PCR. Quantitative data are shown as mean ± SD. *P < 0.05; **P < 0.01. B. Kidney protein levels of TET2 analyzed using western blotting (three randomly selected samples from each group). C. Relative mRNA levels of nephrin and NEPH1 in rat kidney tissues were detected using qRT-PCR. Quantitative data are shown as the mean ± SD. *P < 0.05; **P < 0.01. D. Kidney protein levels of nephrin and NEPH1 analyzed using western blotting (three randomly selected samples from each group). E. Comparison of KIRREL (NEPH1), NPHS1 (nephrin) and TET2 in collapsing focal segmental glomerulosclerosis vs. normal kidney (log2 median-centered intensity). This photo was obtained from the Nephroseq Main website. Colors are z-scores normalized to depict relative values within rows.
