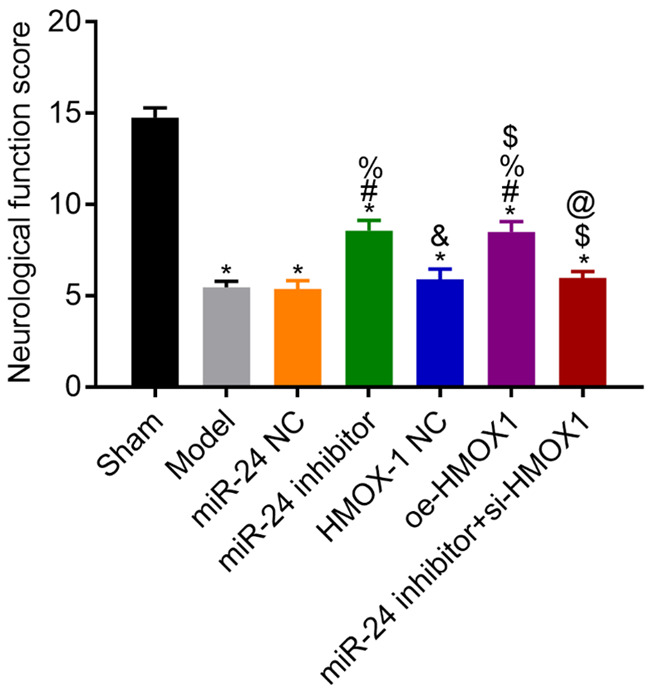
Figure 2.

Scores for the neurological function of rats in each group. Compared with the sham group, *P<0.05; compared with the model group, #P<0.05; compared with the miR-24 NC group, %P<0.05; compared with the miR-24 inhibitor group, &P<0.05; compared with the HMOX-1 NC group, $P<0.05; compared with the oe-HMOX1 group, @P<0.05, n=3.
