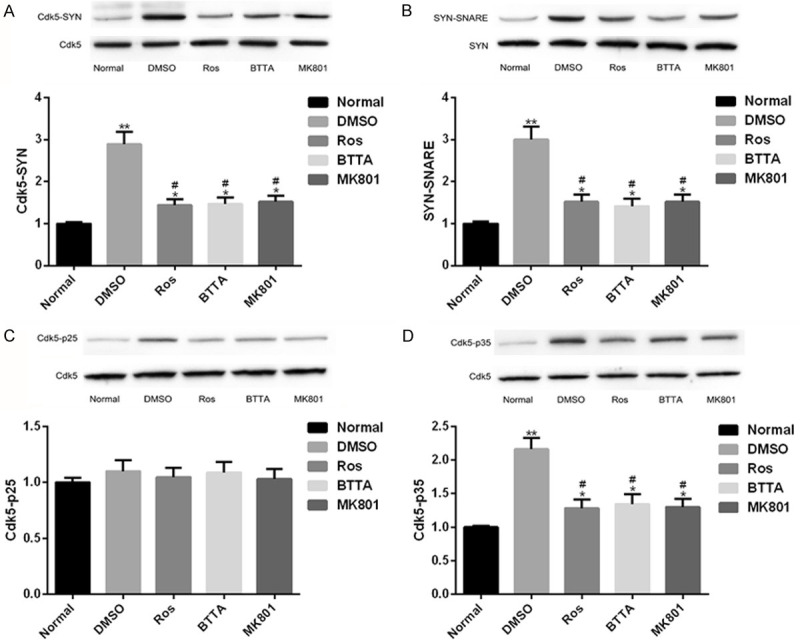
Figure 3.

Protein connection between Cdk5-Syn-SNARE in rat acute pain model. A. Close relationship between Cdk5-Syn protein in acute pain models of rats and its protein map; B. Close relationship between SYN-SNARE protein in acute pain models of rats and its protein map; C. Close relationship between Cdk5-p25 protein in acute pain models of rats and its protein map; D. Close relationship between Cdk5-p35 protein in acute pain models of rats and its protein map. Note: compared with the normal group, *means P < 0.05, **means P < 0.01; compared with DMSO, #means P < 0.05.
