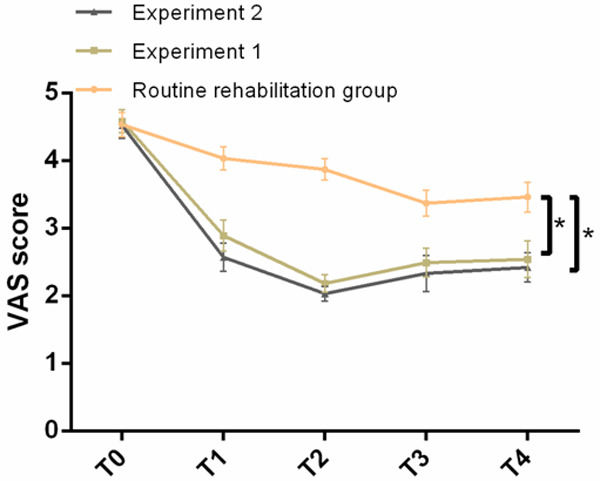
Figure 2.

Comparison of VAS scores of three groups of patients at different time periods before and after intervention. There was no evident difference in the VAS scores of the three groups of patients in T0. The VAS scores of the patients in T1, T2, T3 and T4 in experiment 1 group and experiment 2 group were significantly lower than those in the routine rehabilitation group, while the improvement in the experiment 2 group was significantly better than that in the experiment 1 group. Note: * indicates compared with routine rehabilitation group or comparison between the two groups, P < 0.05.
