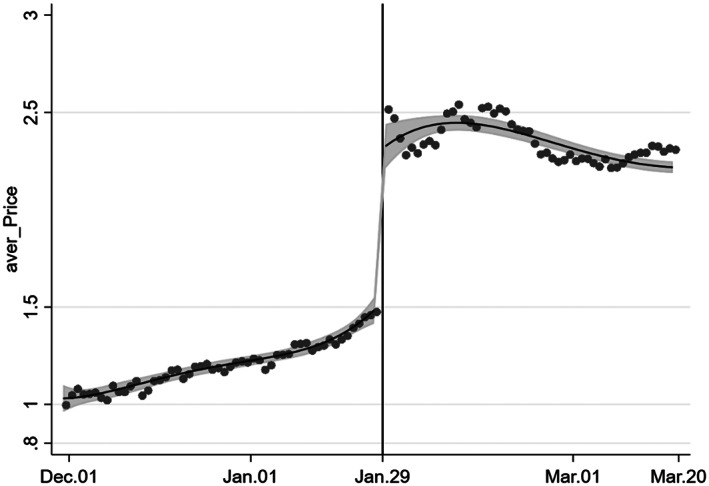
Figure 3.

Discontinuity in Chinese cabbage price. Notes: The solid line shows the fit of fourth‐order polynomial T‐RD estimation and the shaded areas are the 95 percent confidence intervals. The results are robust to the lower orders of polynomial specifications.
