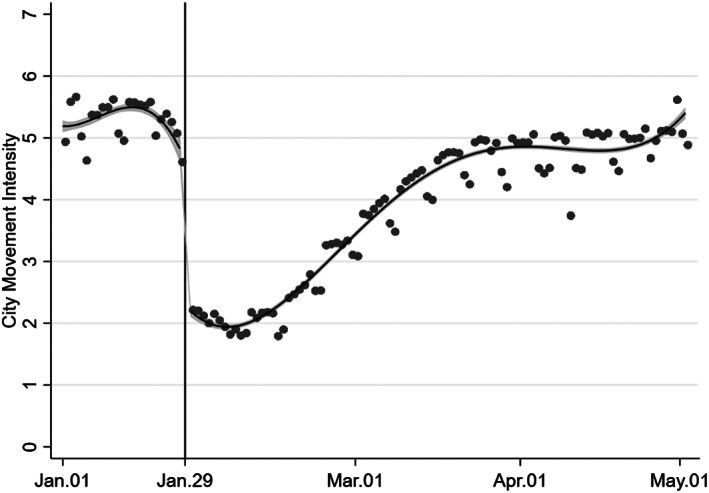
Figure 7.

Discontinuity in labor mobility intensity between cities. Notes: The solid line shows the fit of fourth‐order polynomial T‐RD estimation and the shaded areas are the 95 percent confidence intervals.

Discontinuity in labor mobility intensity between cities. Notes: The solid line shows the fit of fourth‐order polynomial T‐RD estimation and the shaded areas are the 95 percent confidence intervals.