
Figure 1.
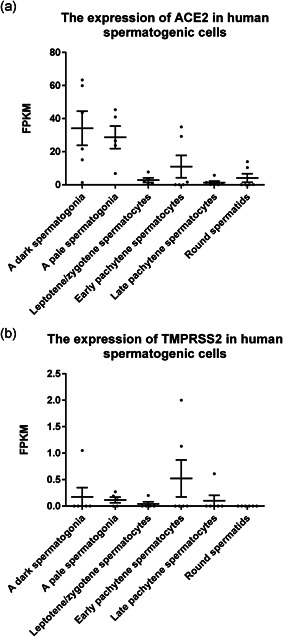
The expression of ACE2 and TMPRSS2 in human spermatogenic cells. Dot plots indicate (a) ACE2 and (b) TMPRSS2 expression in several types of human spermatogenic cells, including spermatogonia, spermatocytes, and spermatids. Data are presented as the mean ± SEM. FPKM, fragments per kilobase of transcript per million mapped reads