
Figure 2.
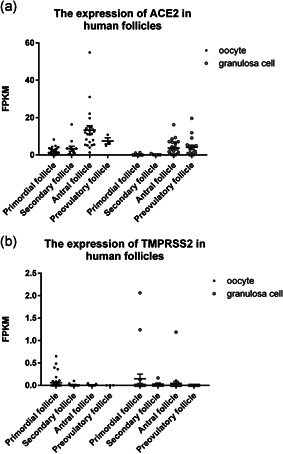
The expression of ACE2 and TMPRSS2 in human follicles. Dot plots indicate (a) ACE2 and (b) TMPRSS2 expression in oocyte and granulosa cells in different stages of human follicles. Data are presented as the mean ± SEM. FPKM, fragments per kilobase of transcript per million mapped reads