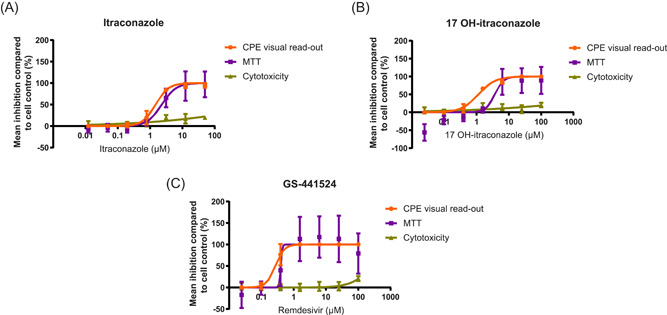
Figure 1.

Effect of either (A) itraconazole, (B) 17‐OH itraconazole, or (C) remdesivir on SARS‐CoV‐2 replication in CPE assays and on viability of Caco‐2 cells. Mean percent inhibition for each readout across two series of three independent experiments (itraconazole, remdesivir) or three independent experiments (17‐OH itraconazole) with triplicate measurements are plotted. The error bars represent the standard deviation. Orange represents CPE visual read‐out; purple represents MTT assay; and green represents cytotoxicity. (A) EC50 by visual scoring of inhibition of CPE = 1.5 μM; EC50 by MTT assay = 2.3 μM (B) EC50 by visual scoring of inhibition of CPE = 1.2 μM; EC50 by MTT assay = 3.6 μM (C) EC50 by visual scoring of inhibition of CPE = 0.3 μM; EC50 by MTT assay = 0.4 μM. CPE, cytopathogenic effect; EC50, concentration of the compound that inhibited 50% of the infection; MTT, 3‐(4,5‐dimethylthiazol‐2‐yl)−2,5‐diphenyltetrazolium bromide; SARS‐CoV‐2, severe acute respiratory syndrome coronavirus 2
