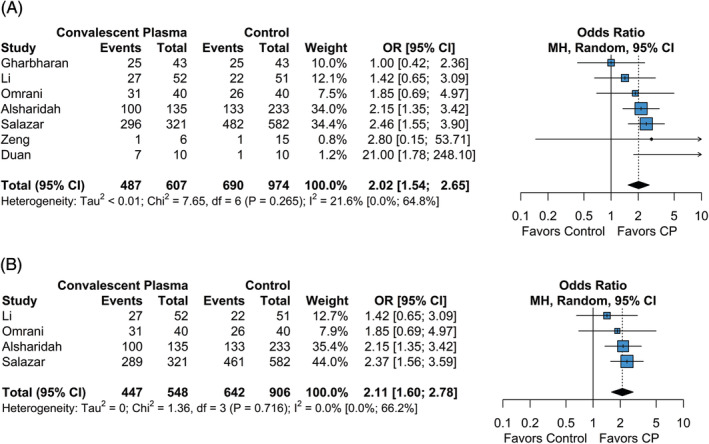
FIGURE 3.

Forest plot of subgroup comparisons of clinical improvement. A, Overall clinical improvement across all follow‐up times. B, Clinical improvement at 28 to 30 day follow‐up. Pooled results were computed using restricted effects maximum likelihood with 95% confidence intervals computed using the Q‐profile method. A 95% prediction interval was also computed (black bar)
