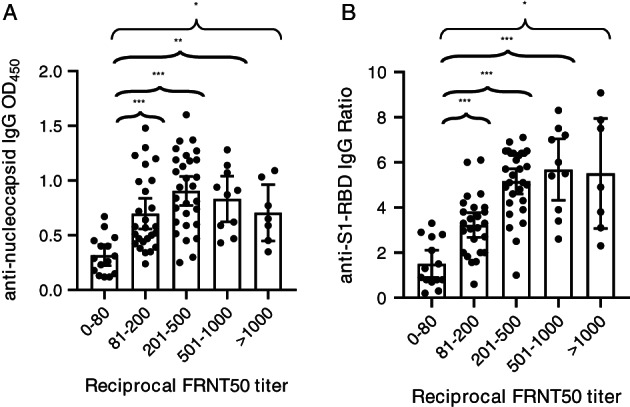
FIGURE 1.

Comparison of reciprocal FRNT50 titer with either anti‐N IgG (A) or anti‐S1‐RBD IgG (B). Data are the mean and 95% CIs for each group of FRNT50 titers. N = 86 for FRNT50 vs anti‐N antibodies and N = 84 for FRNT50 vs anti‐S1‐RBD antibodies. *P < .05, **P < .001, and ***P < .0001 using Welchʼs test for unequal variance
