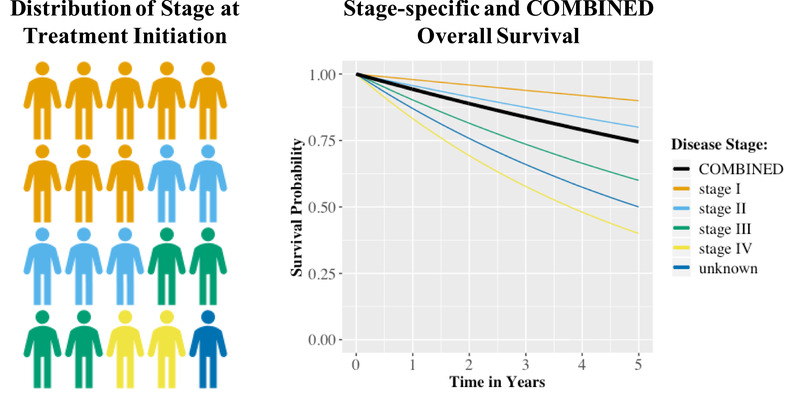
FIGURE 2.

Graphical illustration of how the combined overall survival for a patient population is obtained by weighting stage‐specific survival estimates by the stage distribution at treatment initiation [Color figure can be viewed at wileyonlinelibrary.com]
