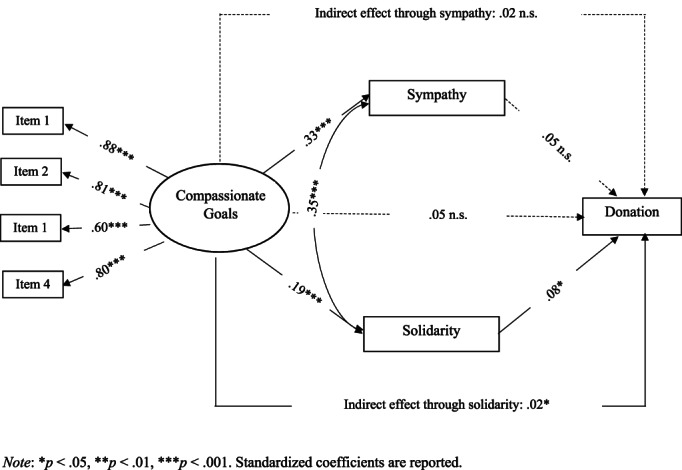
FIGURE 2.

Structural equation modelling results for Study 2. Note: *p < .05, **p < .01, ***p < .001. Standardized coefficients are reported

Structural equation modelling results for Study 2. Note: *p < .05, **p < .01, ***p < .001. Standardized coefficients are reported