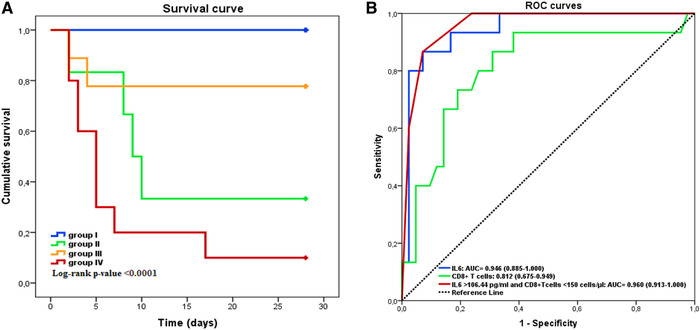
FIGURE 4.

Efficiency of cytokines and lymphocytes subsets in predicting the clinical outcomes of coronavirus disease 2019 (COVID‐19) patients. (A) Kaplan‐Meier survival curves in four groups of COVID‐19 patients. Group I: IL‐6 ⩽ 106.44 pg/ml and CD8+ T cells ⩾150 cells/μl, n = 32. Group II: IL‐6 > 106.44 pg/ml and CD8+ T cells ⩾150 cells/μl, n = 6. Group III: IL‐6 ⩽ 106.44 pg/ml anCD8+ T cells ˂150 cells/μl, n = 9. Group IV: IL‐6 > 106.44 pg/ml and CD8+ T cells ˂150 cells/μl, n = 10. (B) Performance of ROC curves of IL‐6, CD8+ T cells and the combined model in predicting the mortality of patients
