
Figure 2.
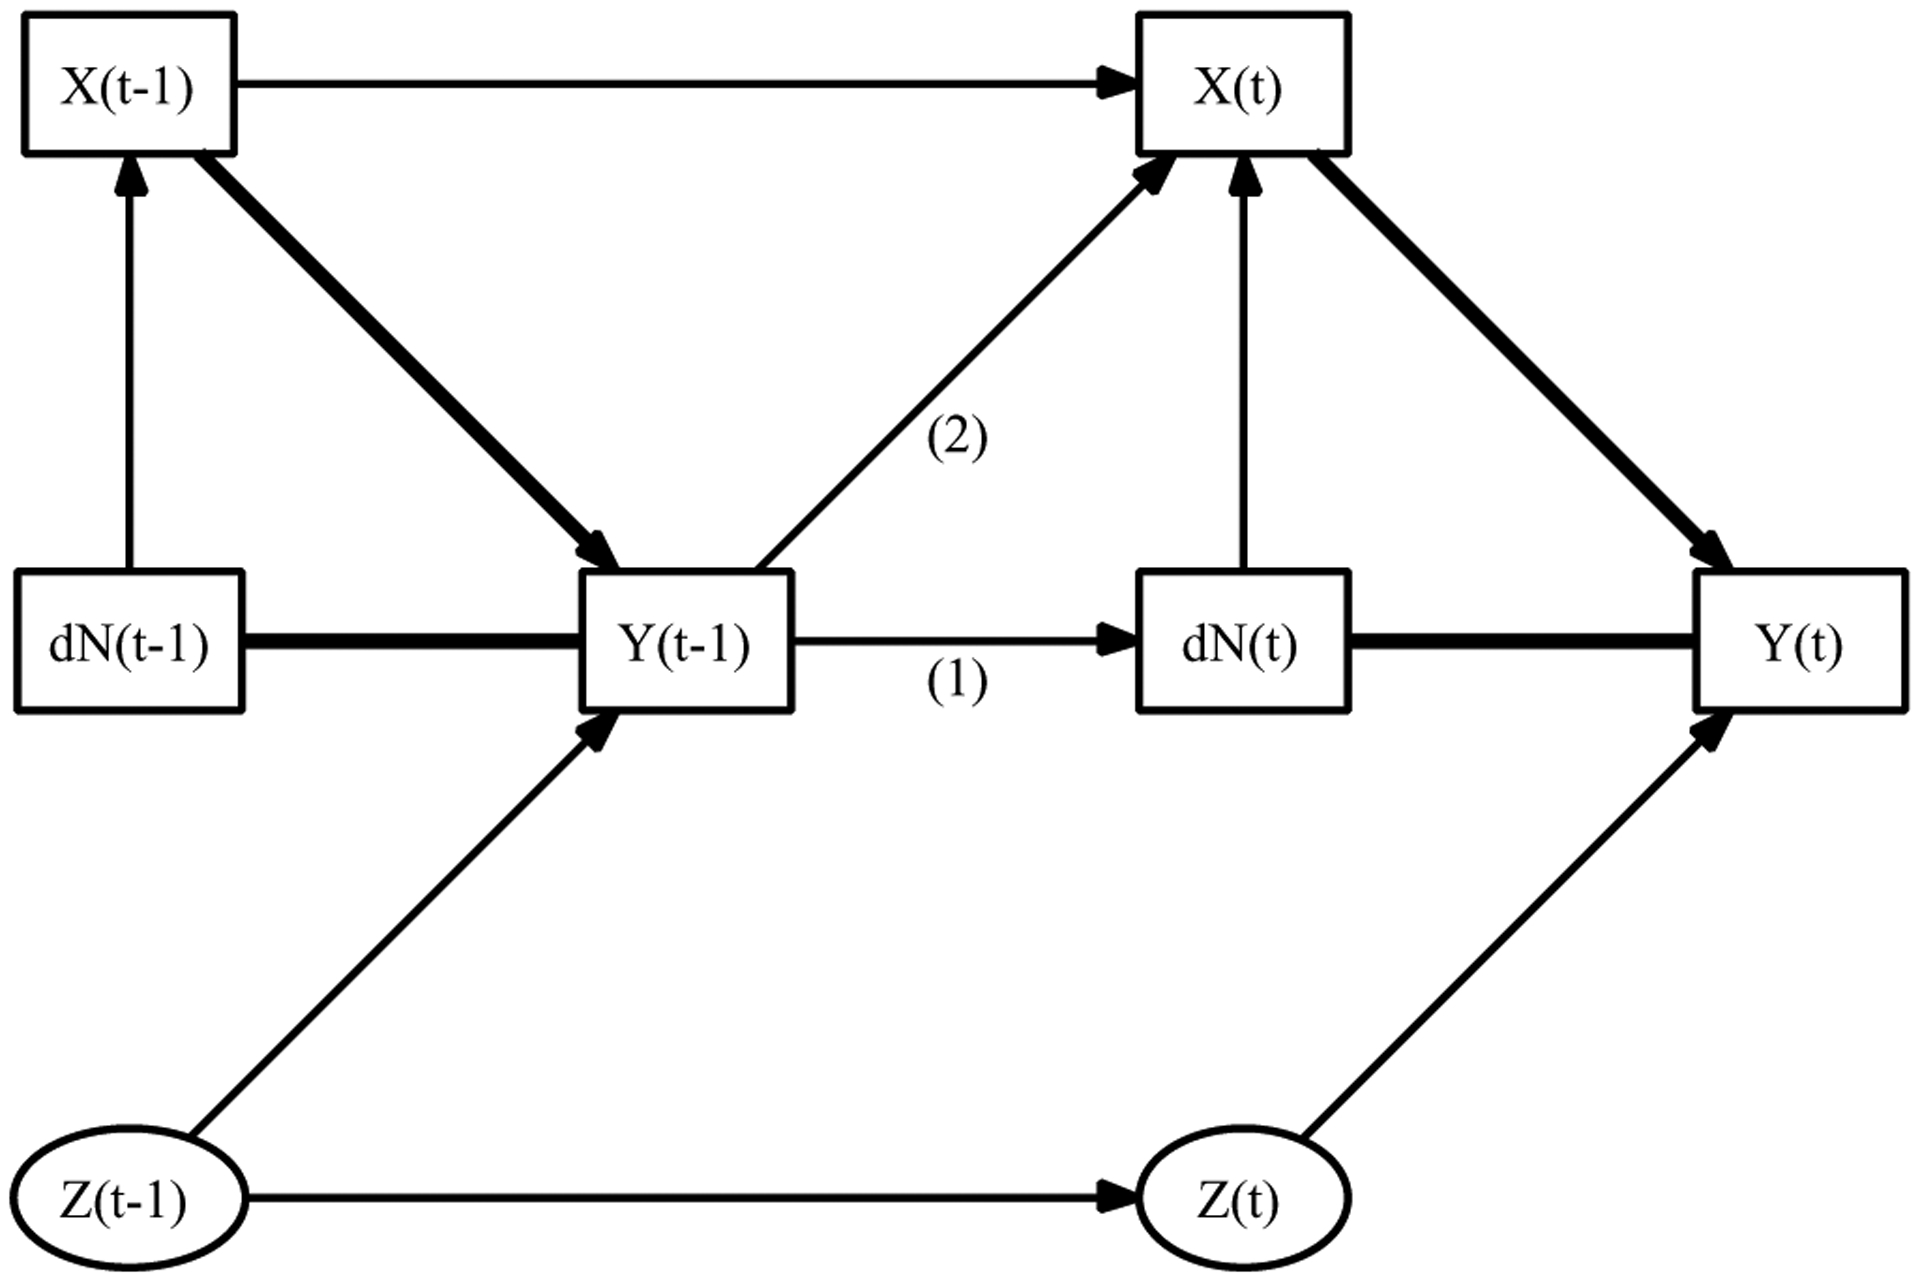
Directed acyclic graph representing conditional dependence relationships for the data generated in our simulation study; Zi (t) represents unmeasured error for the longitudinal process Yi (t).
Official websites use .gov
A
.gov website belongs to an official
government organization in the United States.
Secure .gov websites use HTTPS
A lock (
) or https:// means you've safely
connected to the .gov website. Share sensitive
information only on official, secure websites.
Directed acyclic graph representing conditional dependence relationships for the data generated in our simulation study; Zi (t) represents unmeasured error for the longitudinal process Yi (t).