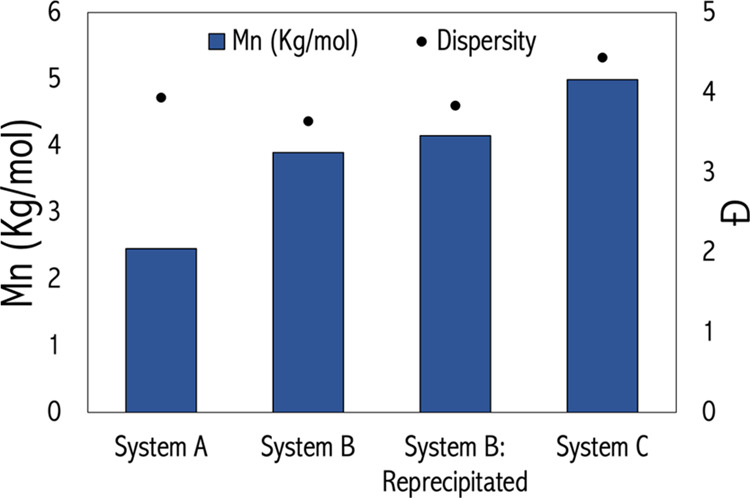
Figure 4.

WSL characterization by GPC in DMF is presented above with x-axis referring to lignin samples from different extraction methods, y-axis (left) is the number average molecular weight (Mn), and y-axis (right) is dispersity (Đ). System B data correspond to the low molecular weight fraction and System C for reactions run at 170 °C.
