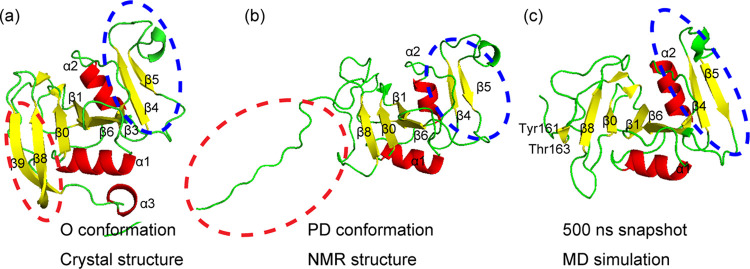
Figure 1.
Structures of O and PD conformations of CD44 HABD. (a) X-ray structure (PDB ID: 1UUH) of the O conformation and (b) structure (PDB ID: 2I83) assigned by NMR analysis of the PD conformation.4 (c) PD refold conformation at 500 ns of MD simulation. The red dashed circles denote the partially disordered region on the conformational shift from O to PD, and the blue dashed circles denote the conformational change at the remote region during the conformational shift from O to PD and the refolding of PD conformation. The figures of (a) and (b) were reprinted with permission from ref (4). Copyright 2006 Elsevier.

