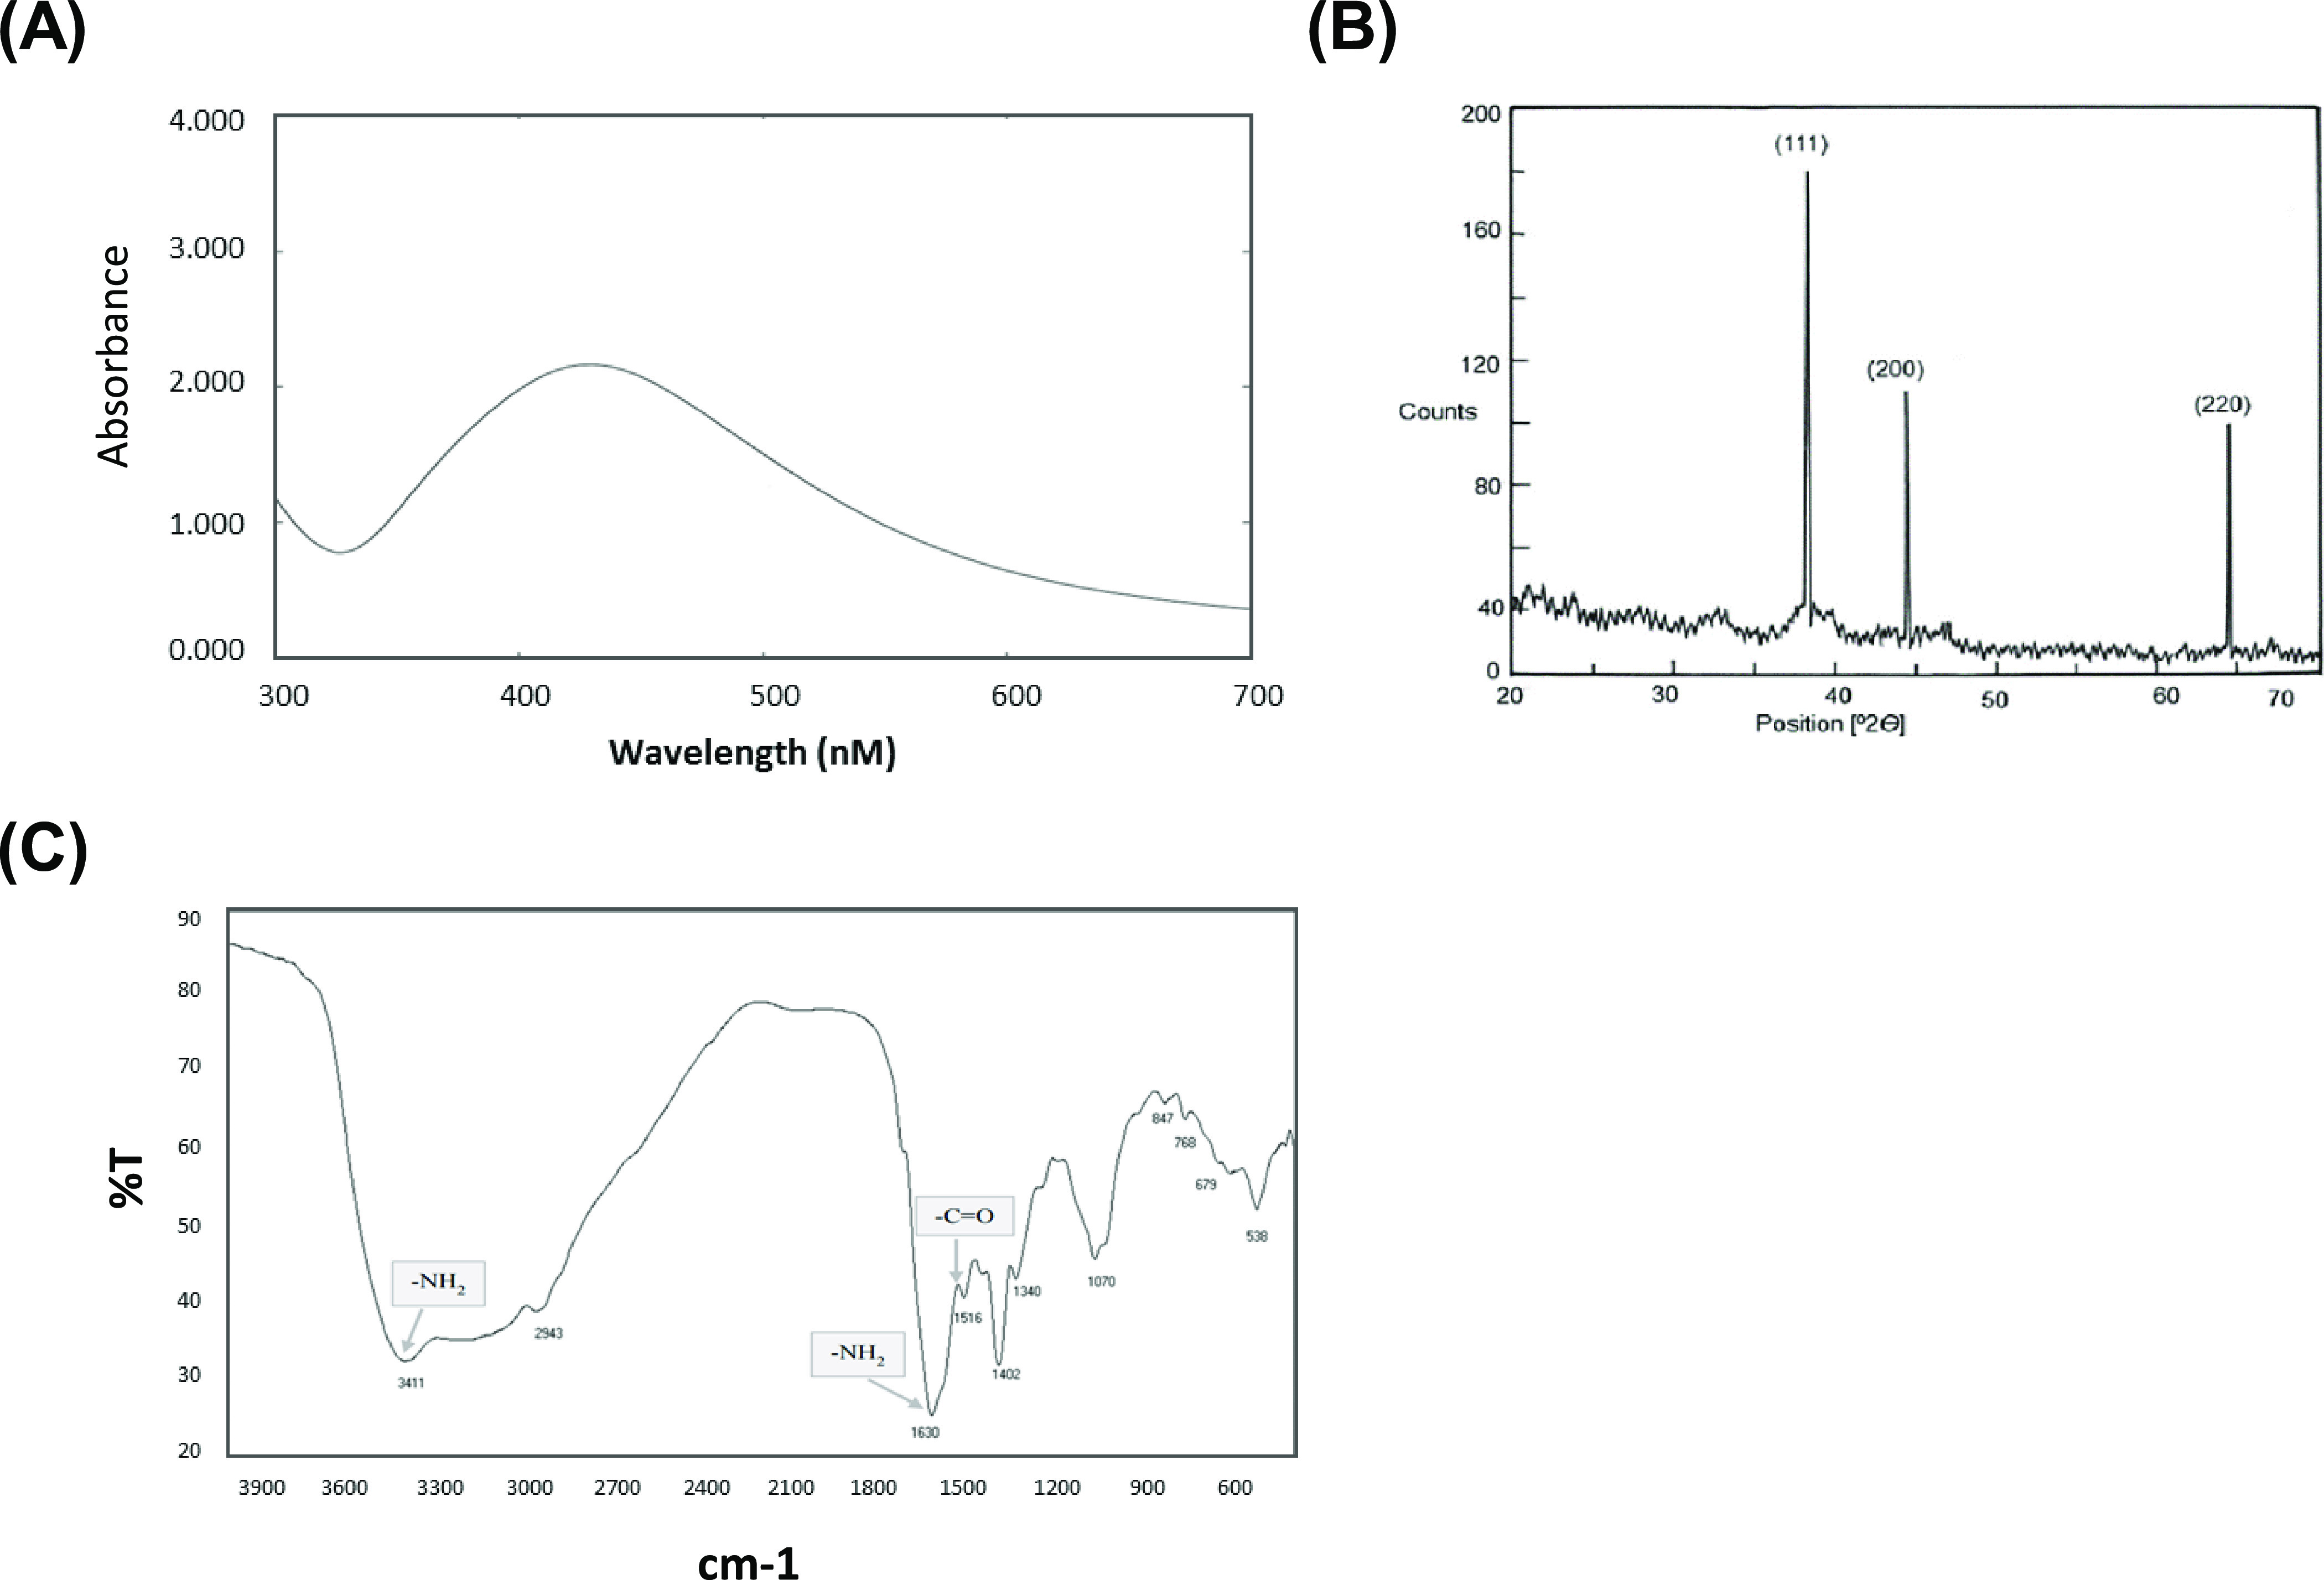
Figure 2.

Confirmation of biosynthesized L-AgNPs. (A) UV–vis spectrum of L-AgNPs. The values of peaks for the UV–vis were plotted between AgNPs/absorbance ratios. The maximum absorbance peak was at around 450 nm, consistent with the surface plasmon resonance of AgNPs. (B) XRD for L-AgNPs displayed three different diffraction bands at 38.18, 44.35, and 64.4° indexed 2θ (degree) values of the (111), (200), and (220) crystalline planes of cubic Ag. (C) FTIR of L-AgNPs showing amide I (−C=O) and amide II (−NH) bands.
