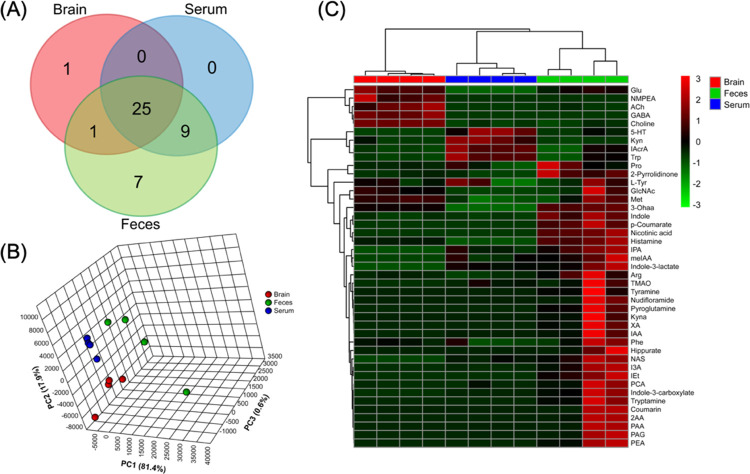
Figure 3.
Tissue-specific distribution of the 50 neurotransmitters and tryptophan metabolites in conventional SPF C57BL/6 mice. (A) Venn diagram of detected compounds; (B) 3D PCA score plot (biological replicates n = 4 for each matrix); and (C) heatmap of metabolite abundance created from sample concentration levels with unit: brain (nmol/g), feces (nmol/g), and serum (μmol/mL).

