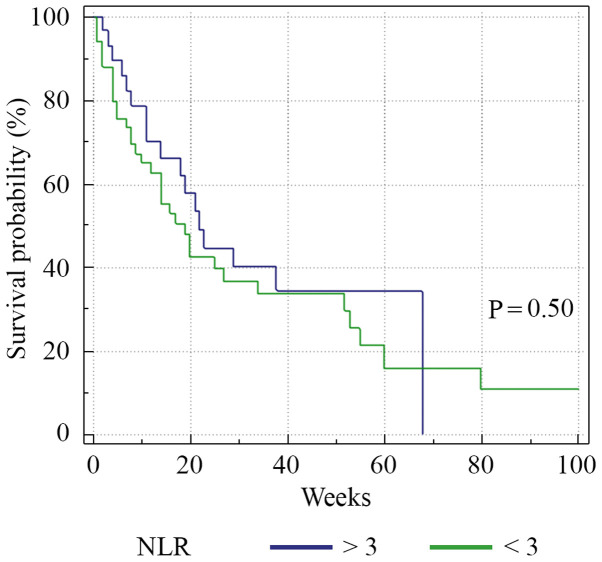
Figure 3.
Kaplan-Meier plots quantifying the effects of NLR on PFS. The horizontal axis represents PFS measured in weeks and the vertical axis represents the percentage of patients who survived without progression at a given time, depending on the NLR value. PFS, progression-free survival; NLR, neutrophil-to-lymphocyte ratio.

