Abstract
The modern epoch of semiconductor nanotechnology focuses on its application in biology, especially in medical sciences, to fetch direct benefits to human life. Fabrication of devices for biosensing and bioimaging is a vibrant research topic nowadays. Luminescent quantum dots are the best option to move with, but most of them are toxic to living organisms and hence cannot be utilized for biological applications. Recent publications demonstrate that surface treatment on the nanoparticles leads to enhanced luminescence properties with a drastic reduction in toxicity. The current work introduces surface-modified CdS, prepared via a simple green chemical route with different medicinal leaf extracts as the reaction media. Lower toxicity and multiple emissions in the visible region, observed for the CdS-O.tenuiflorum hybrid structures, make them a better option for future biological applications. Furthermore, the hybrid structure showed enhanced electrical properties, which promises its use in modifying the current optoelectronic devices.
Introduction
Toxicity of nanoparticles supplanted most of the known semiconductors from biological research activities. Finding an excellent alternative material is still a demanding topic for scientists. Among the wide varieties of equipment in the biomedical field, imaging tools attract special attention due to their ability to view the living cells and tissues from a range of living frameworks. Even though imaging is possible in this small size range, live bioimaging needs continuous monitoring of the system and careful recording of the images, which demands improvisation of the available instruments already existing in the field. Even sophisticated tools such as field-emission scanning electron microscopy (FESEM) is not enough for live bioimaging as the number of living organisms, such as bacteria, will be significantly less at the final multiplication stage due to the exposure of the electron beam1 and is being one of the biggest challenges persisting in the field of bioimaging.2 Expressing the biological data/ medical data in digital form is always a convenient option for the easy diagnosis of diseases. Thus, an efficient imaging tool is required for the tracking of cellular imaging. As the imaging field is concerned, the usual synthetic fluorescent dye has an inherent drawback of getting photobleached.3−5 Hence, quantum dot (QD)-based fluorescent materials can be a wise choice. QDs possess grain size-dependent fluorescence, which can be exploited effectively for their applications in nanobiotechnology. CdS is one of the most widely researched fluorescent materials that is explored already for in vitro cellular imaging.6,7 However, the high level of toxicity limits their application in in vivo applications. Positively charged nanoparticles are more toxic than negatively charged and neutral nanoparticles8,9 because the positively charged nanoparticles can more effectively penetrate through the cell membrane and cause damage to the negatively charged DNA by binding them firmly. Besides, positively charged nanoparticles are rapidly absorbed by the cells in more massive amounts. Thus, protecting them by modifying the surface will reduce the toxicity of nanomaterials.
Here, green chemistry-based synthesis was introduced for CdS to reduce the toxicity, which can be used for exploring its potential in bioimaging and related applications. Three different leaf extracts were used as the media for the growth of CdS nanoparticles. For this purpose, nonseasonal medicinal plant leaves (Chromolaena odorata, Plectranthus amboinicus, and Ocimum tenuiflorum) were chosen, which are widely available over the country. The simple boiling method was opted for the solvent preparation of different medicinal leaves.10 The compounds such as alkaloids, flavonoids, aglycones, tannins, saponins, etc.,11 known as the phytochemicals present in the leaf, can act as covering shells over CdS, which can reduce the effect of surface charges around CdS and hence the toxicity, too.
Experimental Techniques
Sample Preparation
About 20 g (approximate) of the aforementioned cleaned leaves was crushed and boiled with DI (deionized, 200 mL) water and was filtered and collected after cooling to room temperature. For the further synthesis of CdS-GS (green synthesis) hybrid structures, the as-prepared leaf extract solution was used as the medium for the growth of nanoparticles.
The hybrid nanoparticles were prepared as per the schematic shown in Figure 1. For CdS, the usual 1:1 stoichiometry was opted with CdSO4 and CH4N2S as precursors. For the synthesis of a sample with a 6% leaf extract, about 3 mL of leaf extract was poured into two beakers followed by the addition of 22 mL of DI water. The precursors were then added to the beaker and stirred well. Liquid ammonia was added to the beaker containing CdSO4 until the white residue disappeared. 0.5 M CH4N2S solution was then poured into the blend solution. The total solution was then made into 100 mL. The powder samples were then filtered out and washed thoroughly before drying in an oven to remove the unconjugated contents of the leaf extract. In order to avoid sulfur vacancies in the hybrid sample, all the nanopowders (after the drying process) were treated with the sulfur precursor separately. The experimental procedure was repeated with 10, 20, and 50% of leaf extract. The samples were labeled as LT (CdS-O. tenuiflorum), LC (CdS-C. odorata), and LP (CdS-P. amboinicus) for convenience (details are tabulated in Table 1). For comparison, CdS nanoparticles were also synthesized without any leaf content.
Figure 1.
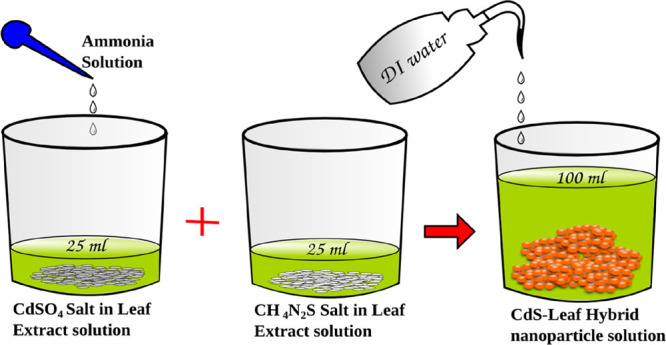
Schematic for the synthesis of the hybrid-nanoparticle of CdS-GS.
Table 1. Details of the Samples Synthesized Using the Extract of the Leaves of C. odorata (C), P. amboinicus (P), and O. tenuiflorum (T).
| sample name LX (X = C, P, T) | total volume of leaf solution in 100 mL (%) |
|---|---|
| LX1 | 6 |
| LX2 | 10 |
| LX3 | 20 |
| LX4 | 50 |
| CdS | 0 |
Material Characterization
The samples were structurally, chemically, and morphologically characterized by X-ray diffractometry (Rigaku Miniflex-600), high-resolution TEM (JEOL, JEM-2100), FT-IR spectroscopy (PerkinElmer Spectrum Two), and Raman spectroscopy (WITec GmbH, Ulm, Germany, Alpha 300RA AFM & RAMAN). Thermal stability of the samples was analyzed by thermogravimetric analysis (PerkinElmer STA 6000). Cytotoxicity of the samples was evaluated with a Multi-mode plate reader (PerkinElmer, Enspire at 570 nm) using human cervical cancer cells (HeLa). For the elemental analysis of the sample LT4, the FESEM setup (Zigma, Zeiss) was employed. A PerkinElmer UV–vis spectrophotometer (Lambda 35) and fluorescence spectrometer (LS 55) were utilized for capturing the absorbance and emission spectra. A Floid Evos imaging system was used to record the cellular imaging of the samples at 20× magnification. Electrical properties of the samples (in the form of pellets of 10 mm diameter prepared using a KBr automatic pelletizer) were checked in the frequency range of 100 Hz to 10 kHz using a Wayne Kerr-LCR impedance analyzer (6500 B).
To evaluate the toxicity of CdS and CdS-GS hybrid nanostructures, an MTT assay was carried out.12−16 The colorless MTT dye is converted into a purple color (known as formazan crystals) by the NADH-dependent oxidoreductase enzyme present in the mitochondria of the live cells. The color of the dye and the toxicity of the material are inversely proportional. The HeLa cells with 90% confluency were collected and seeded at 1 × 10⁴ cells/well in a 96-well cell culture plate and 37 °C/5% CO2. After 24 h, the medium was aspirated and treated with CdS or CdS-GS hybrid structures at various concentrations. To the well, which contained HeLa cells and the samples (CdS, LT4, LP4, LC4, and CdSO4), 20 μL of MTT dye was added after 24 h. The plates were then incubated for 3 h. After removing the medium, 100 μL of DMSO (dimethyl sulfoxide) was added to dissolve the formazan crystals that were formed by the conversion of MTT by the live cells. The absorbance was read at 570 nm using a multi-mode plate reader.
Results and Discussion
For leaf solvent preparation, different methods are adopted by researchers, which vary depending on their application. Typically, the powdered form of the leaf residue suspended in water, or any other solvents like methanol, ethanol, acetone ethyl acetate, hexane, chloroform, and butanol, is used for the extraction of pigments or phytochemicals from the leaf. For the current synthesis, the method of direct boiling of the leaf was opted without making it in the powder form. The filtered part of the supernatant solution prepared in DI water was directly used further for the hybrid-nanoparticle synthesis. No alcohol treatment was done before or after the leaf extract preparation. This method allows direct attachment of the phytochemical to the nanoparticles compared to other external components.
Previous phytochemical studies have shown that almost all the leaf extract contains common chemical constituents like alkaloids, flavonoids, glycosides, tannins, saponins, carbohydrates, steroids, and proteins.17,18 Among them, phenolic metabolites (phenolic acid, polyphenols, flavonoids) have extensive research potential owing to their dietary applications.19 These are the components that protect plants from oxidative damage and serve as good antioxidants for living animals. Historical stories point out that humans have been using these medicinal plants through food intake 5000 years back for curing and preventing diseases like cancer and cardiovascular issues.20 Since the extraction of leaves is water-based, there are only a few active phenolic compounds compared to alcohol-based leaf extracts.19 The degrading temperatures of the active chemical constituents of the leaves are different. Thus, a part of the active components is assumed to be covering the nanoparticles as a protective covering.
Synthesis with a higher concentration of precursors at low temperature (RT ∼28–30 °C) can lead to the growth of nuclei in such a way as to achieve minimum surface energy by forming spherical nanoparticles. Since the adopted growth method is solution-based, most of the particles form aggregates to reduce the enormous surface energy of the tiny nanoparticles. Due to the presence of phytochemicals of the leaf extracts, monomer availability could be controlled (not all the Cd, or the S complex will participate in the reaction), which limits the growth rate. Final nuclei of CdS or the aggregated structure CdS is expected to be covered by the phytochemicals of the leaf extracts. These hybrid structures are entirely protected against oxygen attack, leading to the formation of a stable CdS-leaf hybrid structure.
All the hybrid samples, along with the unmodified CdS nanoparticles, were structurally analyzed with an X-ray diffractometer. The recorded patterns are shown in Figure 2. Both the CdS and the CdS-GS hybrid structures demonstrate the hexagonal crystal structure. The samples with a higher volume of leaf extract showed broad hexagonal peaks, which is an evidence for the presence of smaller nanoparticles in the samples LT4, LP4, and LC4. The interpretation of the result can be as follows: the phytochemicals present in the leaf extract impede fast growth of the CdS nanoparticles, and a slight modification in the peak value arises from the surface modification induced by the components of the leaf extract. Researchers already explored the leaf extract as a reducing agent21 for metal nanoparticle synthesis22,23 and as a surfactant to reduce the nanoparticle growth rate. Here, the leaf extract with different unknown phytochemicals is expected to behave like a surfactant due to the decrease in growth kinetics of the CdS-GS hybrid structure. There is a large number of unidentified phytochemicals in the leaf extract, which may cover the surface of the CdS nanoparticle like a shell. Deviation observed in the lattice parameter values (Table S1) suggests internal stress inside the material,24 which is then evaluated by the W-H analysis. The plot derived from the W-H analysis is provided in Figures S1–S4. From the study, strain values are obtained as negative, which can be attributed to compressive stress within the material.25 Crystallite sizes calculated from both the Debye–Scherrer method and W-H analysis demonstrate that their results are comparable, and the crystallite sizes are found to be below 50 Å for all the samples.
Figure 2.
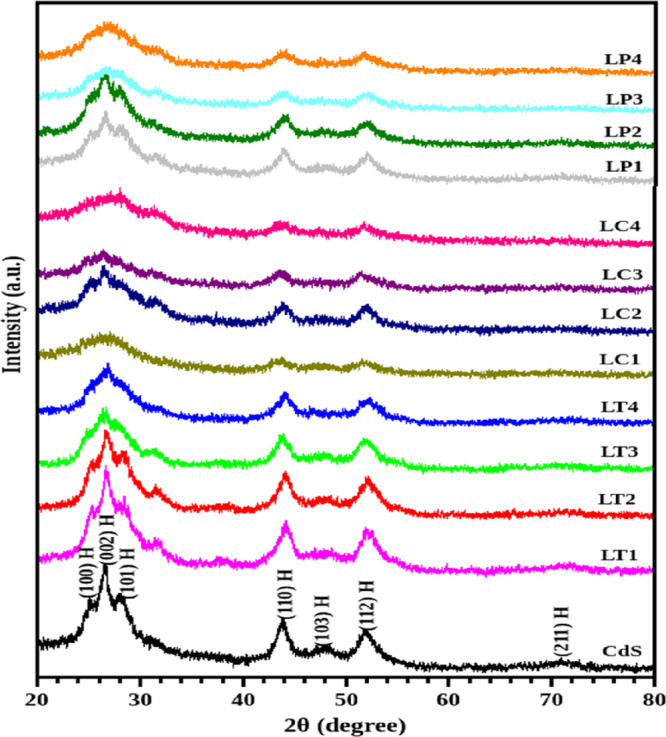
X-ray diffraction patterns of CdS and different CdS-GS hybrid structures with P. amboinicus (LP), C. odorata (LC), and O. tenuiflorum (LT) leaf extracts.
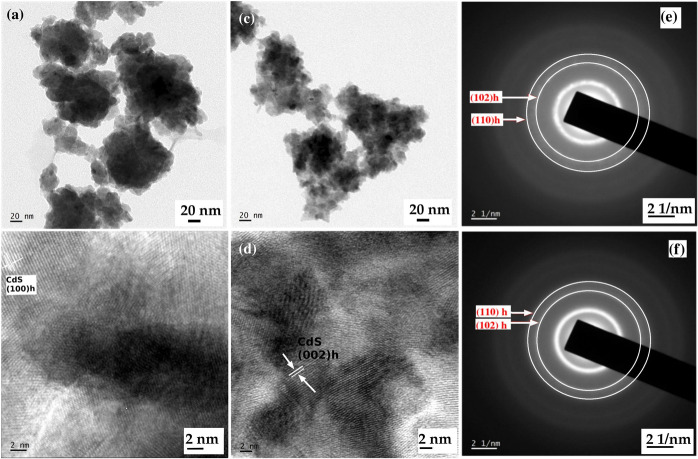
The TEM micrographs of the CdS and CdS-O. tenuiflorum hybrid (LT4) nanostructures are depicted in Figure 3. Both the samples are agglomerated, and the identification of individual particles is difficult. From the ring-like electron diffraction patterns of the sample, hexagonal phase formation is confirmed and is indexed as the (102) h and (110) h planes. Instead of the usual dots, the bright rings in the ED pattern authenticate the formation of smaller particles in both the samples.
Figure 3.
TEM images of (a,b) CdS and (c,d) CdS-O. tenuiflorum hybrid and their corresponding electron diffraction patterns (e,f) representing the hexagonal planes as concentric rings.
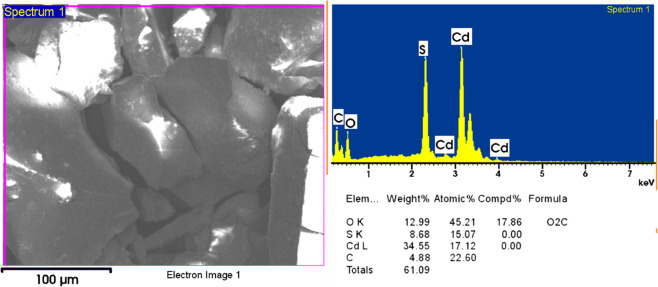
Energy-dispersive X-ray analysis was performed to verify the hybrid formation and to understand the stoichiometry ratio of Cd to S. The spectrum of the selected area elemental analysis is demonstrated in Figure 4. The elements identified in the study are carbon (C), oxygen (O), cadmium, and sulfur. The ratio of Cd to S remains to be 1:1. The weight percentages of C and O authenticate the presence of phytochemicals from the leaf extract. Thus, the elemental analysis is a confirmation test for the attachment of different contents of the leaf extract with the CdS nanoparticles.
Figure 4.
Selected area elemental analysis of the CdS-O. tenuiflorum hybrid (LT4) representing the existence of the Cd-to-S ratio as 1:1 with carbon and oxygen percentages.
The Fourier transform infrared spectra of the three CdS-GS hybrids are illustrated in Figure 5. The vibrations around 3150–3350 and 1594 cm–1 are attributed to the stretching of the −OH group, which indicates the presence of water content on the surface of the CdS nanoparticle. The peak at 1464 cm–1 is evolved from the vibration of carbon (C) with hydrogen (H). The phytochemicals of the leaf extract consist of C, H, and O as the elements in their structure, and then the vibration of C and H is a signature for the presence of phytochemicals on the surface of CdS. Thus, the FT-IR results agree well with the elemental analysis. The vibrations of Cd–S bonds are obtained at 795, 614, 559, and 464 cm–1. Thus, the modification of the surface of the CdS nanoparticle is evident from the IR spectra of the hybrid samples.
Figure 5.
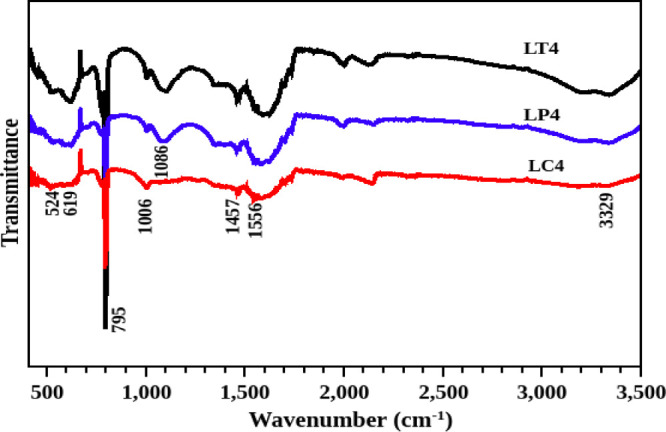
Infrared spectra of CdS and different CdS-GS hybrid structures.
The Raman spectra of the samples are depicted in Figure 6a. The peak at 294 cm–1 indicates the fundamental longitudinal phonon-vibration. The overtones are observed at 588 and 893 cm–1. Compared to the bulk CdS, the actual vibration is shifted26,27 to a lower-energy region. Compared to the peaks of CdS, the peaks of CdS-GS hybrids are less intense and broad, which is due to the presence of smaller particles. Peaks other than the optical vibration originate from multiphonon scattering.28 From Figure 6b, the shift in the first overtone is evident with peak broadening arising from the surface modification induced by the phytochemicals of the leaf extract. From the crystallite size calculation, the size of CdS is larger than that of the hybrid structure; the intensities of the peaks in the Raman spectra support these results.
Figure 6.
(a) Raman spectra of CdS and CdS-GS hybrid structures and (b) the part of the Raman spectra show the shifts in the values of longitudinal optical vibration.
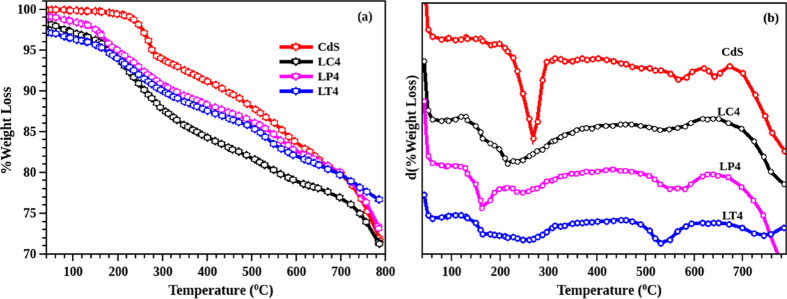
The thermograms of all the samples are depicted in Figure 7a. It is evident from the thermal analysis that decomposition of CdS has three different stages. The first one is the evaporation of volatile compounds from the surface, which is observed in the temperature below 200 °C (see the derivative of TGA in Figure 7b) for the hybrid structure. The other two stages include the removal of sulfur from the surface and the transition of CdS to CdSO4 or CdO. The unmodified CdS experienced an initial weight loss at a temperature of 250 °C. Figure 7b shows the derivative of the thermogram, representing the peak at which a different transition takes place. Unmodified CdS has thermal stability up to a temperature of 580 °C, and the hybrid structure follows a similar nature. The total weight loss values of all the samples are approximately the same (∼70%). This result shows that the stability of the nanoparticle remains unaffected even in the presence of the leaf content. When compared to the hybrid structures, CdS-O.tenuiflorum has lower weight loss than others, showing enhanced thermal stability.
Figure 7.
(a) Thermograms and the corresponding (b) differential plots of CdS and CdS-GS extract hybrid, containing maximum concentration of the leaf extract (50%).
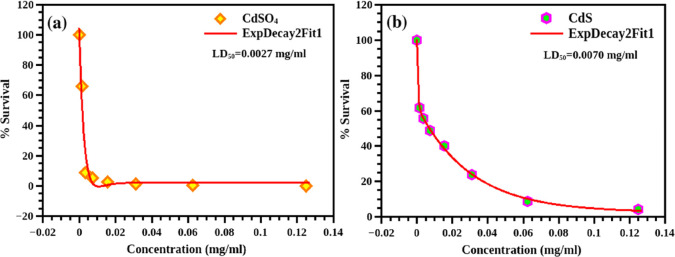
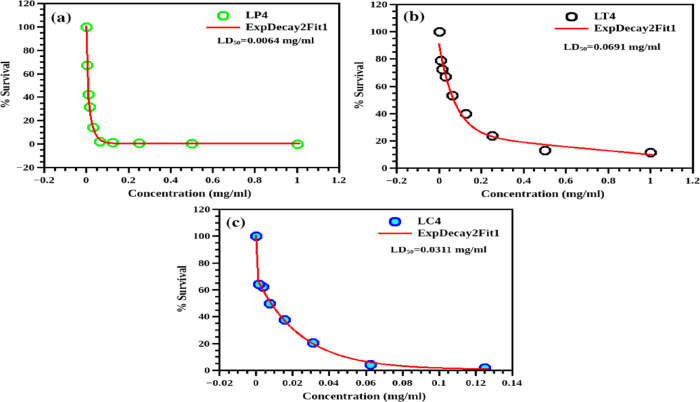
The MTT assay results are plotted with the concentration on the X-axis and cell survival (in %) on the Y-axis (Figure 8). The cell viabilities of the CdS and CdS-GS hybrids are demonstrated in Figures 8,b and 9a–ca. For a comparative study, the toxicity of the cadmium precursor (CdSO4) is also evaluated. The LD50 values, the concentration of the sample required to kill 50% of the cells, are calculated from the graph. A large LD50 value is indicative of lower toxicity. Here, the LD50 value is the highest for the CdS-O. tenuiflorum hybrid (0.0691 mg/mL), while it is the minimum for CdSO4 (0.0027 mg/mL).
Figure 8.
Percentage of survival of the cells obtained from the MTT assay for (a) CdSO4 and (b) CdS.
Figure 9.
Cell viability of the CdS-GS hybrid structure with different concentrations of the nanopowders: (a) CdS-P. amboinicus (LP4), (b) CdS-O. tenuiflorum (LT4), and (c) CdS-C. odorata (LC4).
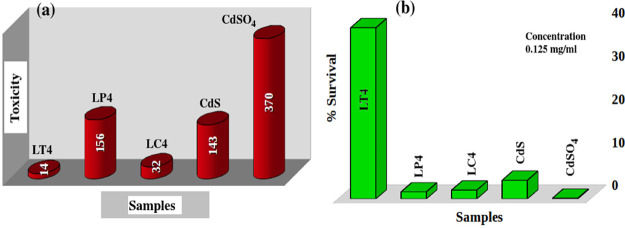
The LD50 value of the unmodified CdS is 0.0070 mg/mL (values are tabulated in Table 2). A histogram illustrated in Figure 10a presents the toxicity of each sample calculated from the LD50 values (they are inversely proportional) and cell viability at a concentration of 0.125 mg/mL (Figure 10b), which clearly shows the improved biocompatibility for the CdS-O. tenuiflorum hybrid sample. Reyes-Esparza et al.7 reported improved biocompatibility in dextrin-capped CdS. According to them, a concentration less than 1 μg/mL is not at all toxic to HeLa cells. Here, the concentration is very much higher than those in the published research works. The approximate LD50 values reported29 for CdS nanoparticles on HeLa cells are in between 3 and 4 μg/mL. Thus, using the O. tenuiflorum leaf extract as the protective cover of the surface of CdS, its toxicity can be tailored. Further tailoring can be done by varying the shell thickness to reduce the toxicity of CdS, which can finally bring the toxicity levels down to the acceptable range for cellular studies. With the strong inherent PL in the visible range, this improved biocompatibility can make CdS one of the most promising candidates for bioimaging especially for in vitro cellular imaging. Here, a simple green chemical route is suggested for the synthesis of CdS, which makes the CdS biocompatible.
Table 2. LD50 Values of All the Samples Evaluated by the MTT Assay.
| sample | LD50 (mg/mL) |
|---|---|
| CdSO4 | 0.0027 |
| CdS | 0.0070 |
| LC4 | 0.0311 |
| LP4 | 0.0064 |
| LT4 | 0.0691 |
Figure 10.
Histogram that presents (a) toxicity comparison in CdSO4, CdS, and CdS-GS extract hybrid as well as their (b) percentages of survival at a concentration of 0.25 mg/mL. Toxicity is indicated as the inverse of LD50.
All the samples were dispersed in DI water and then sonicated. The solution was then subjected to UV–vis spectroscopy. The recorded data of absorbance is then plotted against the wavelength (Figure S5A(a–c)). The absorption peak values of all the samples are blue-shifted with the increase in leaf extract content. The shift in the peak is attributed to the quantum confinement effect, which results from the tiny particles in the CdS-GS hybrid. The peak values are 455, 454, and 440 nm, respectively, for the samples LT4, LP4, and LC4. The corresponding band energy values are 2.72, 2.73, and 2.81 eV, respectively, showing drastic enhancement compared to the band gap of bulk CdS. Thus, analysis of the absorbance of the CdS-GS hybrid shows clear evidence for the presence of tiny particles, and the result supports the XRD analysis.
The emission spectra of the CdS-GS hybrid structures are shown in Figure S5B(a–c) at an excitation of 400 nm. Since the samples are treated separately with the sulfur source, defect-mediated emission is absent here. In all the cases, the peaks are seen below 550 nm. In the case of the CdS-C. odorata hybrid (Figure S5B(a)), all the samples exhibit multiple emissions at an excitation of 400 nm. The peaks are centered at 460, 480, and 530 nm. All of them represent the band-to-band emission of CdS, from the different-sized CdS nanoparticles. Since the method followed here is chemical precipitation, the size distribution of nanoparticles is expected to be broader, especially smaller particles (below 5 nm). As the density of the particle distribution varies, the intensity of emission also changes. Thus, from the emission spectrum, it is evident that, as the leaf extract concentration increases, the density of smaller particles increases, and the peak at 460 nm enlarges. For the CdS-P. amboinicus hybrid nanostructure (Figure S5B(b)), except LP4, all the samples have an intense peak at 530 nm due to emission from the direct recombination of CdS (band-to-band emission). Here also, an enhancement in the intensity of the higher energy peak is observed with the increase in leaf solvent concentration due to the contribution from small-sized particles.
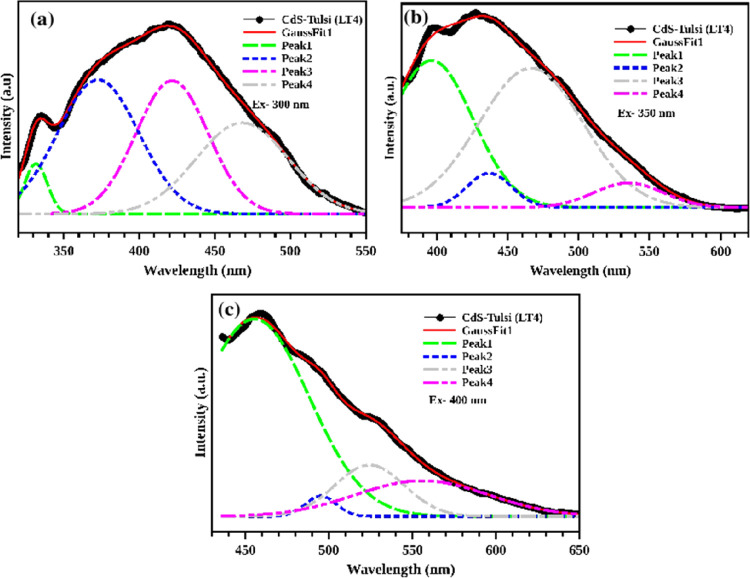
The emission spectra of the CdS-O. tenuiflorum hybrid structure is evaluated at three different excitation energies, 300, 350, and 400 nm, and are shown in Figure 11a–c. All the graphs show multiple emissions in the visible region. Compared to the excitation of 350 and 400 nm, the peak at the excitation wavelength of 300 nm is broad, and the emission peaks at 372, 421, and 468 nm are equally distributed. Other peaks are centered at 396, 436, 466, and 535 nm for the excitation of 350 nm, and other peaks are centered at 455, 495, 524, and 555 nm for the excitation of 400 nm. Thus, the hybrid sample can be utilized for the fabrication of multicolored light-emitting devices by the careful tailoring of the size distribution.
Figure 11.
Multipeak emission in the less toxic CdS-O. tenuiflorum hybrid at different excitations: (a) 300, (b) 350, and (c) 400 nm.
As the application of CdS or CdS-GS for cellular imaging is an essential aspect of the current study, the cells were treated with CdS or CdS-GS and viewed under a fluorescence microscope. There exists a double-layered lipid known as the cell membrane, which separates the content of the cell (cytoplasm) from the surroundings. The cell membrane does not allow all the materials to enter into the cell (selective permeability of the cell membrane). Here, the nanoparticle enters into the cell via the pinocytosis/endocytosis process.30
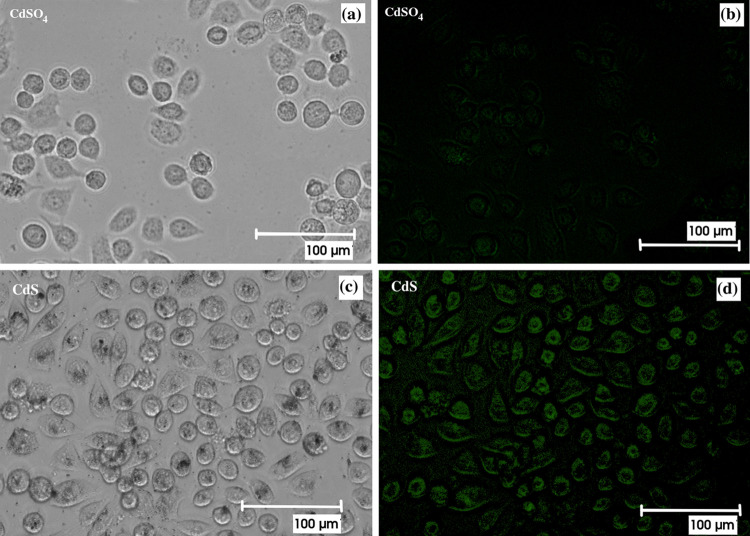
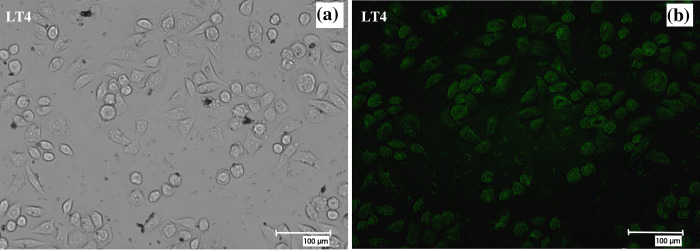
Figure 12a,c, Figure S6a,c, and Figure 13a present the bright-field and fluorescence images of the HeLa cells treated with CdS or CdSO4. The cells are visible in the bright-field images. Round-shaped cells represent cell death. It is evident from the figure that pure CdS results in fast cell death. A similar behavior is obtained for the CdS-P. amboinicus and CdS-C. odorata hybrid structures. However, for the CdS-O. tenuiflorum hybrid, which already showed lower toxicity in MTT assays, the percentage of cell death is comparably lower. The corresponding cellular fluorescence of the hybrid is demonstrated in Figure 13b. The cells showed bright green fluorescence showing clear evidence for the cellular imaging property of the biocompatible CdS evolved from the green synthesis method.
Figure 12.
Bright-field and fluorescence images of the cells in the presence of (a,b) CdS and (c,d) CdSO4; cell death is visible by the round shape of the cell.
Figure 13.
Bright-field (a) and fluorescence images (b) of the cells in the presence of the CdS-O. tenuiflorum hybrid structure showing green fluorescence.
The green synthesis of CdS using O. tenuiflorum enhances the biocompatibility of CdS by reducing the cytotoxicity without comprising its imaging potential. CdS nanoparticles are known to induce cytotoxicity because of the free surface charges around the NPs while inside the cells.31 The O. tenuiflorum leaf derived organic compounds might have a role in the detoxification of CdS-induced free charges inside the cells. This observation needs to be further investigated.
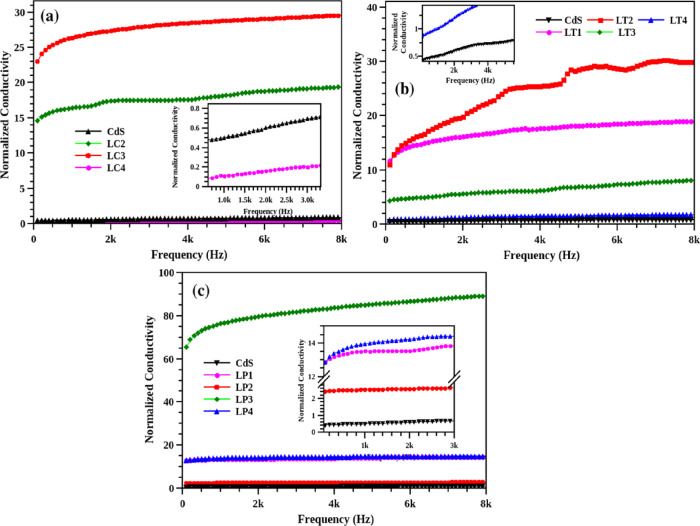
The electrical conductivity of the sample is obtained from the conductance measurement (after including its possible error corrections). The sample in the form of a pellet acts as a dielectric between the two parallel plates (contacts). The charges inside the material are separated due to the applied field. As a result of this, the material is polarized. Only low-frequency dependence of conductivity is discussed here since the graph shows a saturated behavior after 10 kHz. Due to the large space charge polarization, which is a function of the surface area, the expected trend was not obtained. Here, the electrical conductivity studied in very small-sized nanoparticles and even a minute change in particle size will drastically modify the surface area at this regime.
The normalized electrical conductivities of the CdS-GS hybrid structures are illustrated in Figure 14. All the hybrids demonstrated huge enhancement in conductivity compared to the unmodified CdS nanoparticles. The hybrid system did not follow any specific order for the enhancement in electrical conductivity, which may be attributed to the variation in the size and structure of the hybrid sample. By increasing the leaf extract concentration, monodispersed CdS NPs can be synthesized where the phytochemicals prevent the fast growth of CdS nanoparticles. Even though the samples were treated separately with the sulfur source, there may be defects (∼1–2%) in the system. These can be another reason for the irregularity in the obtained conductivity values.
Figure 14.
Normalized electrical conductivities of CdS and different CdS-GS hybrid structures concerning CdS, (a) LC series (b) LT series, and (c) LP series.
Conclusions
Green synthesis was successfully employed for the growth of CdS nanoparticles using a simple wet chemical route. The three different leaf extracts, which were used for the surface modification of the CdS nanoparticle, are medicinal plants and are available throughout the year. A facile boiling method was implemented for the solvent preparation from the leaf, which was used in the reaction without any further modification. The growth dynamics of the CdS nanoparticles can be controlled by varying the leaf solvent concentration. The cytotoxicity of the hybrid, assessed via the MTT assay, revealed that the CdS-O. tenuiflorum hybrid is less toxic than the unmodified CdS and other hybrid structures. The EDAX analysis of the hybrid structure confirmed the attachment of phytochemicals of the leaf extract with CdS. The stoichiometric ratio of Cd/S was 1:1 as evident from the elemental analysis, suggesting the absence of vacancy-mediated emission in the fluorescence spectra. Multiple emission peaks in the visible region of the absorption spectra for the CdS-GS hybrid are attributed to the contribution from different-sized nanoparticles. The results project their potential in the fabrication of biocompatible light-emitting devices. Their in vitro cellular imaging applications are also tested and proven.
Acknowledgments
We gratefully acknowledge DST-India (DST-SERB India; DST Nos. SB/YS/LS-366/2013, YSS/2014/000436, and IF131099-DST/INSPIRE Fellowship/2013), DBT-India (Grant No. 6242-P52/RGCB/PMD/DBT/RPKT/2015), CSIR (Ref. No. 09/1108(0005)/2015-EMR-I), and the Central University of Kerala for the financial support, M G University Kottayam for TEM measurements, and Mangalore University for EDAX measurements. R.P and S.S.N. acknowledge the establishments and facilities provided by the Central University of Kerala, India.
Supporting Information Available
The Supporting Information is available free of charge at https://pubs.acs.org/doi/10.1021/acsomega.1c00519.
W-H plots of CdS, LC, LP, and LT series, a table of crystallite size and lattice parameter calculations, absorbance and emission measurements of LT, LP, and LC series, bright-field and fluorescence images of CdS-C. odorata and CdS-P. amboinicus (PDF)
The authors declare no competing financial interest.
Supplementary Material
References
- De Jonge N.; Peckys D. B. Live Cell Electron Microscopy Is Probably Impossible. ACS Nano 2016, 10, 9061–9063. 10.1021/acsnano.6b02809. [DOI] [PubMed] [Google Scholar]
- Sharma P.; Brown S.; Walter G.; Santra S.; Moudgil B. Nanoparticles for Bioimaging. Adv. Colloid Interface Sci. 2006, 471–485. 10.1016/j.cis.2006.05.026. [DOI] [PubMed] [Google Scholar]
- Song L.; Hennink E. J.; Young I. T.; Tanke H. J. Photobleaching Kinetics of Fluorescein in Quantitative Fluorescence Microscopy. Biophys. J. 1995, 68, 2588–2600. 10.1016/S0006-3495(95)80442-X. [DOI] [PMC free article] [PubMed] [Google Scholar]
- Vogelsang J.; Kasper R.; Steinhauer C.; Person B.; Heilemann M.; Sauer M.; Tinnefeld P. A Reducing and Oxidizing System Minimizes Photobleaching and Blinking of Fluorescent Dyes. Angew. Chem., Int. Ed. 2008, 47, 5465–5469. 10.1002/anie.200801518. [DOI] [PubMed] [Google Scholar]
- Eggeling C.; Widengren J.; Rigler R.; Seidel C. A. M. Photobleaching of Fluorescent Dyes under Conditions Used for Single-Molecule Detection: Evidence of Two-Step Photolysis. Anal. Chem. 1998, 70, 2651–2659. 10.1021/ac980027p. [DOI] [PubMed] [Google Scholar]
- Rempel S. V.; Kozhevnikova N. S.; Aleksandrova N. N.; Rempel A. A. Fluorescent CdS Nanoparticles for Cell Imaging. Inorg. Mater. 2011, 47, 223–226. 10.1134/S0020168511030186. [DOI] [Google Scholar]
- Reyes-Esparza J.; Martínez-Mena A.; Gutiérrez-Sancha I.; Rodríguez-Fragoso P.; de la Cruz G. G.; Mondragón R.; Rodríguez-Fragoso L. Synthesis, Characterization and Biocompatibility of Cadmium Sulfide Nanoparticles Capped with Dextrin for in Vivo and in Vitro Imaging Application. J. Nanobiotechnol. 2015, 13, 83. 10.1186/s12951-015-0145-x. [DOI] [PMC free article] [PubMed] [Google Scholar]
- Sukhanova A.; Bozrova S.; Sokolov P.; Berestovoy M.; Karaulov A.; Nabiev I. Dependence of Nanoparticle Toxicity on Their Physical and Chemical Properties. Nanoscale Res. Lett. 2018, 44. 10.1186/s11671-018-2457-x. [DOI] [PMC free article] [PubMed] [Google Scholar]
- Huang Y.-W.; Cambre M.; Lee H.-J. The Toxicity of Nanoparticles Depends on Multiple Molecular and Physicochemical Mechanisms. Int. J. Mol. Sci. 2017, 10.3390/ijms18122702. [DOI] [PMC free article] [PubMed] [Google Scholar]
- Jeeva K.; Thiyagarajan M.; Elangovan V.; Geetha N.; Venkatachalam P. Caesalpinia Coriaria Leaf Extracts Mediated Biosynthesis of Metallic Silver Nanoparticles and Their Antibacterial Activity against Clinically Isolated Pathogens. Ind. Crops Prod. 2014, 52, 714–720. 10.1016/j.indcrop.2013.11.037. [DOI] [Google Scholar]
- Sirinthipaporn A.; Jiraungkoorskul W. Wound Healing Property Review of Siam Weed, Chromolaena Odorata. Pharmacogn. Rev. 2017, 35–38. 10.4103/phrev.phrev_53_16. [DOI] [PMC free article] [PubMed] [Google Scholar]
- Bahadar H.; Maqbool F.; Niaz K.; Abdollahi M. Toxicity of Nanoparticles and an Overview of Current Experimental Models. Iran. Biomed. J. 2016, 1–11. 10.7508/ibj.2016.01.001. [DOI] [PMC free article] [PubMed] [Google Scholar]
- Kong B.; Seog J. H.; Graham L. M.; Lee S. B. Experimental Considerations on the Cytotoxicity of Nanoparticles. Nanomedicine 2011, 929–941. 10.2217/nnm.11.77. [DOI] [PMC free article] [PubMed] [Google Scholar]
- Kaba S. I.; Egorova E. M. In Vitro Studies of the Toxic Effects of Silver Nanoparticles on HeLa and U937 Cells. Nanotechnol. Sci. Appl. 2015, 8, 19–29. 10.2147/NSA.S78134. [DOI] [PMC free article] [PubMed] [Google Scholar]
- Vijayakumar S.; Ganesan S. In Vitro Cytotoxicity Assay on Gold Nanoparticles with Different Stabilizing Agents. J. Nanomater. 2012, 2012, 1. 10.1155/2012/734398. [DOI] [Google Scholar]
- Sahu D.; Kannan G. M.; Tailang M.; Vijayaraghavan R. In Vitro Cytotoxicity of Nanoparticles: A Comparison between Particle Size and Cell Type. J. Nanosci. 2016, 2016, 1–9. 10.1155/2016/4023852. [DOI] [Google Scholar]
- Rajesh H.; Rao S. N.; Prathima K. S.; Megha R. N.; Rejeesh E. P.; Lovelyn J. PHYTOCHEMICAL ANALYSIS OF AQUEOUS EXTRACT OF OCIMUM SANCTUM LINN. Int. J. Univers. Pharm. Bio Sci. 2013, 2, 462–468. [Google Scholar]
- Sunitha P.; Sathyanarayana N.; Suresh V. C.; Sreeramanan S.; Annie J. S.; Xavier R. Phytochemical and Antioxidant Analysis of the Leaf Extract of Malaysian Medicinal Plant Abroma Augusta L. Indian J. Pharm. Sci. 2018, 80, 192–198. 10.4172/pharmaceutical-sciences.1000344. [DOI] [Google Scholar]
- Do Q. D.; Angkawijaya A. E.; Tran-Nguyen P. L.; Huynh L. H.; Soetaredjo F. E.; Ismadji S.; Ju Y. H. Effect of Extraction Solvent on Total Phenol Content, Total Flavonoid Content, and Antioxidant Activity of Limnophila Aromatica. J. Food Drug Anal. 2014, 22, 296–302. 10.1016/j.jfda.2013.11.001. [DOI] [PMC free article] [PubMed] [Google Scholar]
- Weli A. M.; Al-Salmi S.; Al Hoqani H.; Hossain M. A. Biological and Phytochemical Studies of Different Leaves Extracts of Pteropyrum Scoparium. Beni-Suef Univ. J. Basic Appl. Sci. 2018, 7, 481–486. 10.1016/j.bjbas.2018.05.001. [DOI] [Google Scholar]
- Chung I.-M.; Rahuman A. A.; Marimuthu S.; Kirthi A. V.; Anbarasan K.; Padmini P.; Rajakumar G. Green Synthesis of Copper Nanoparticles Using Eclipta Prostrata Leaves Extract and Their Antioxidant and Cytotoxic Activities. Exp. Ther. Med. 2017, 14, 18–24. 10.3892/etm.2017.4466. [DOI] [PMC free article] [PubMed] [Google Scholar]
- Rao K. J.; Paria S. Aegle Marmelos Leaf Extract and Plant Surfactants Mediated Green Synthesis of Au and Ag Nanoparticles by Optimizing Process Parameters Using Taguchi Method. ACS Sustainable Chem. Eng. 2015, 3, 483–491. 10.1021/acssuschemeng.5b00022. [DOI] [Google Scholar]
- Aljabali A. A.; Akkam Y.; Al Zoubi M. S.; Al-Batayneh K. M.; Al-Trad B.; Alrob O. A.; Alkilany A. M.; Benamara M.; Evans D. J. Synthesis of Gold Nanoparticles Using Leaf Extract of Ziziphus Zizyphus and Their Antimicrobial Activity. Nanomaterials 2018, 8, 174. 10.3390/nano8030174. [DOI] [PMC free article] [PubMed] [Google Scholar]
- Jelski D. A.; George T. F.. Computational Studies of New Materials; World Scientific: 1999, 10.1142/3654. [DOI] [Google Scholar]
- Zalilah U.; Mahmoodian R.. Comparative Study on Microstructure, Crystallite Size and Lattice Strain of as-Deposited and Thermal Treatment Silver Silicon Nitride Coating on Ti6Al4V Alloy. In IOP Conference Series: Materials Science and Engineering; IOP Publishing: 2017; Vol. 210, 10.1088/1757-899X/210/1/012074. [DOI] [Google Scholar]
- Hu C.; Zeng X.; Cui J.; Chen H.; Lu J. Size Effects of Raman and Photoluminescence Spectra of CdS Nanobelts. J. Phys. Chem. C 2013, 117, 20998–21005. 10.1021/jp407272u. [DOI] [Google Scholar]
- Trajić J.; Gilić M.; Romčević N.; Romčević M.; Stanišić G.; Hadžić B.; Petrović M.; Yahia Y. S. Raman Spectroscopy of Optical Properties in Cds Thin Films. Sci. Sinter. 2015, 47, 145–152. 10.2298/SOS1502145T. [DOI] [Google Scholar]
- Kumar P.; Saxena N.; Chandra R.; Gupta V.; Agarwal A.; Kanjilal D. Nanotwinning and Structural Phase Transition in CdS Quantum Dots. Nanoscale Res. Lett. 2012, 7, 584. 10.1186/1556-276X-7-584. [DOI] [PMC free article] [PubMed] [Google Scholar]
- Hossain S. T.; Mukherjee S. K. Toxicity of Cadmium Sulfide (CdS) Nanoparticles against Escherichia Coli and HeLa Cells. J. Hazard. Mater. 2013, 260, 1073–1082. 10.1016/j.jhazmat.2013.07.005. [DOI] [PubMed] [Google Scholar]
- Zhao J.; Stenzel M. H. Entry of Nanoparticles into Cells: The Importance of Nanoparticle Properties. Polym. Chem. 2018, 259–272. 10.1039/c7py01603d. [DOI] [Google Scholar]
- Mirnajafizadeh F.; Ramsey D.; McAlpine S.; Wang F.; Stride J. Nanoparticles for Bioapplications: Study of the Cytotoxicity of Water Dispersible CdSe(S) and CdSe(S)/ZnO Quantum Dots. Nanomaterials 2019, 9, 465. 10.3390/nano9030465. [DOI] [PMC free article] [PubMed] [Google Scholar]
Associated Data
This section collects any data citations, data availability statements, or supplementary materials included in this article.


