Figure 3.

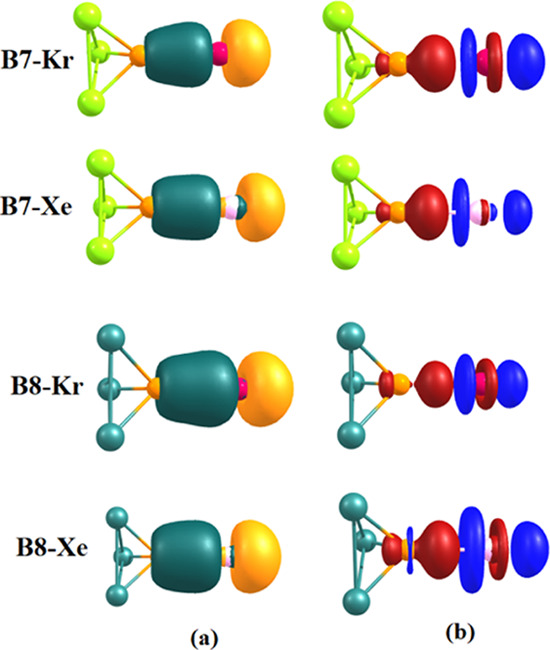
(a) Bonding molecular orbital of the complexes featuring Ng → B dative bond and (b) density difference plot of the donor–acceptor adducts (red = density increment, blue = density depletion).

(a) Bonding molecular orbital of the complexes featuring Ng → B dative bond and (b) density difference plot of the donor–acceptor adducts (red = density increment, blue = density depletion).