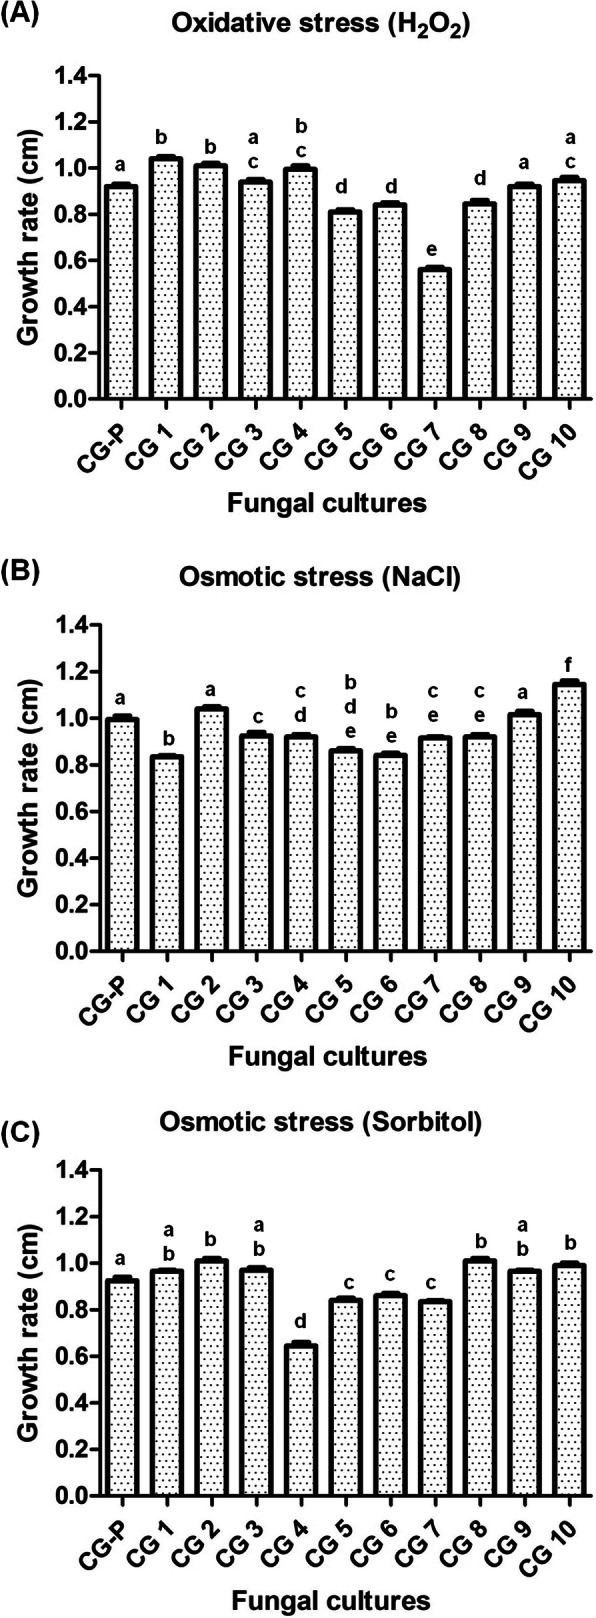
Fig. 9.

Growth rate (cm) of C. gloeosporioides parent (CGP) and their heterokaryotic progenies (CG1–10) under different stresses. a Growth rate in presence of oxidative stress induced by H2O2. b Growth rate in presence of osmotic stress induced by NaCl. c Growth rate in osmotic stress induced by sorbitol. Average from 3 replicates and bar indicates standard deviation. Statistical significance of differences was analyzed by one-way Tukey’s multiple comparison post-hoc test (bars with the same letter are not significantly different; p ≤ 0.05)
