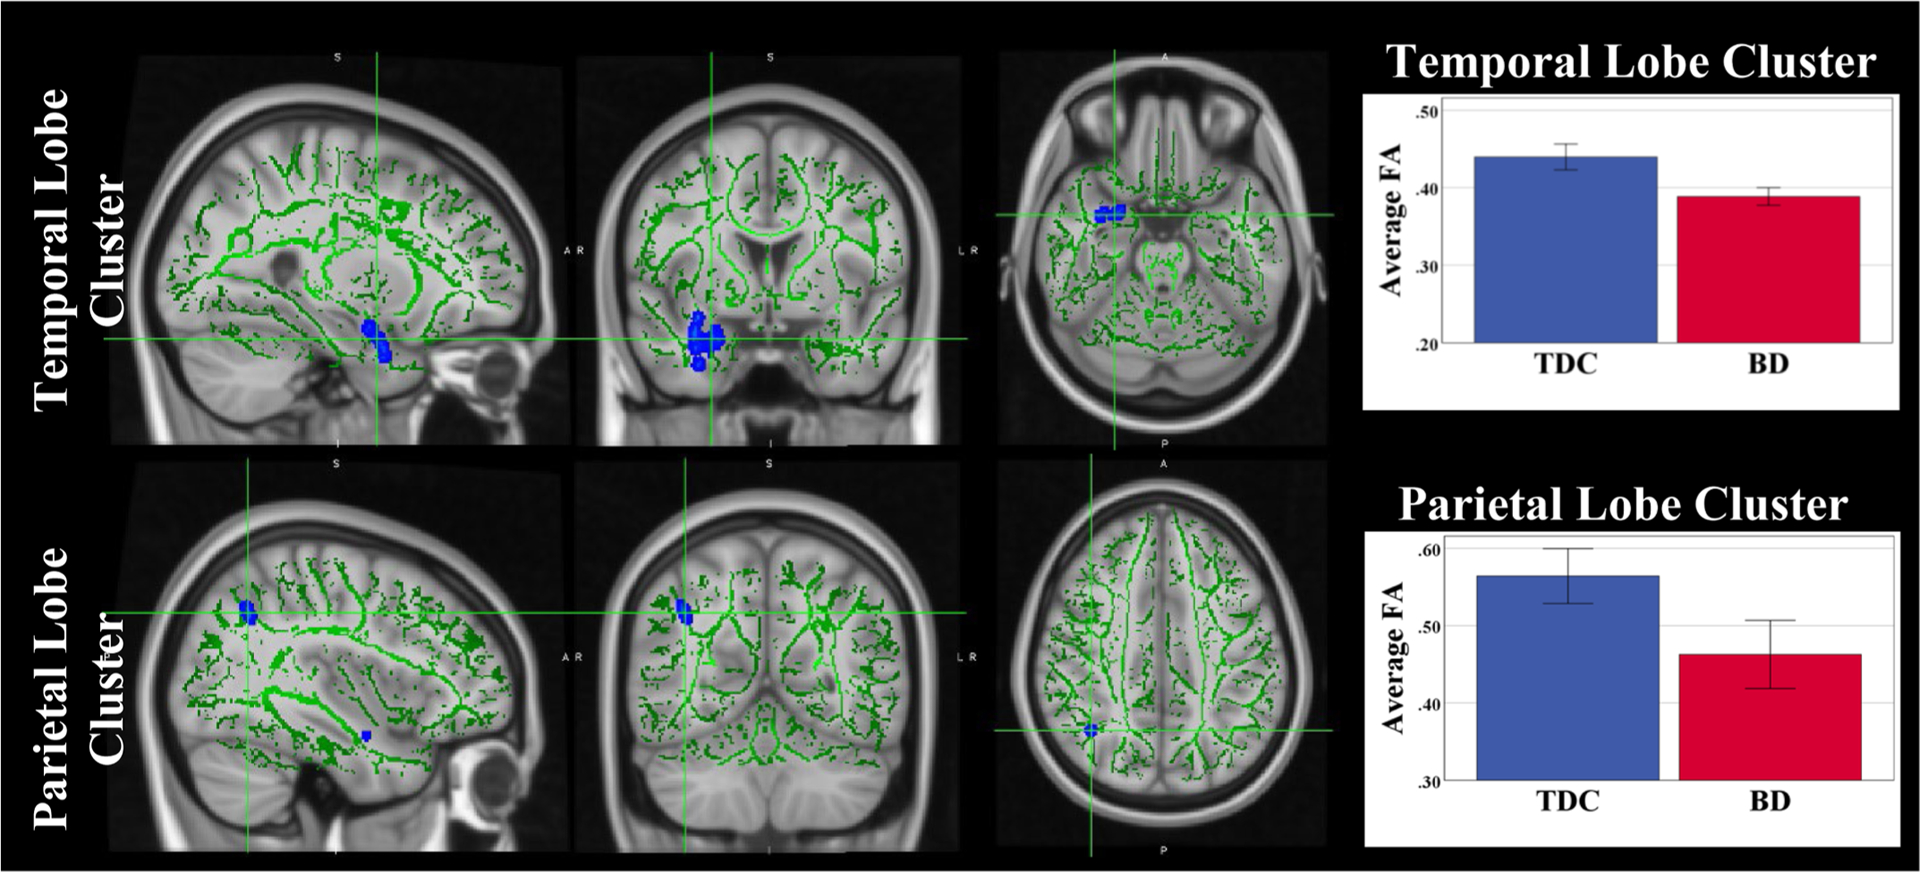
Fig. 1.

FA Differences in youth with Bipolar Disorder as compared to TDC. Voxels with significant p-values are displayed in blue/light blue) with thickened outline for better visualization. The remaining portions of the TBSS skeleton are shown in green. Error bars show ± 2SE.
