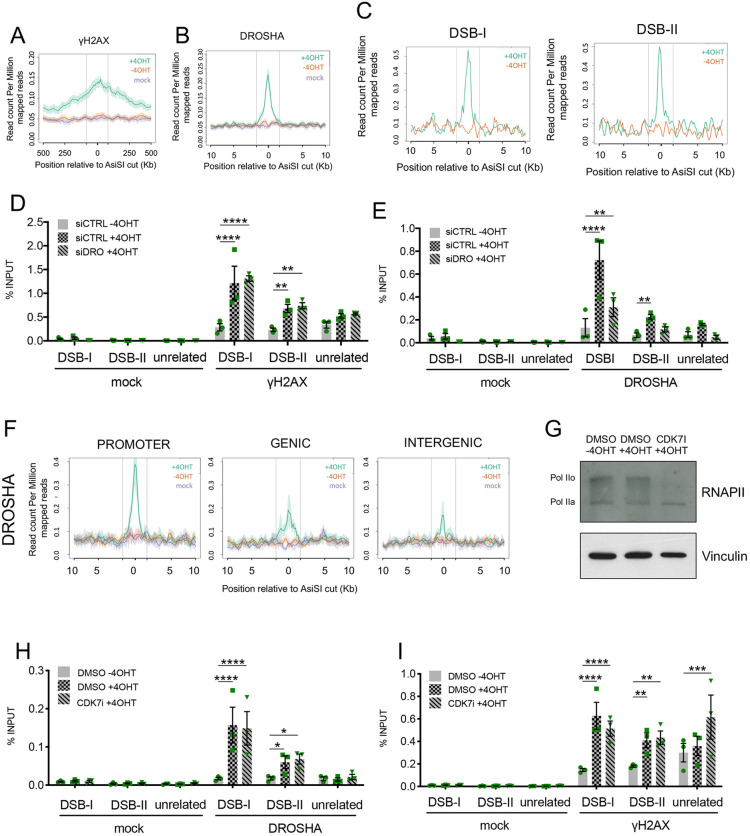
Fig. 1.
DROSHA accumulates at sites of DNA damage. (A) Mean±s.e.m. γH2AX ChIP-seq signals of the 50 most cut AsiSI sites, over 1 Mb windows and centered at the AsiSI site, are shown for cut (+4OHT, green), uncut (−4OHT, red) or mock (magenta) samples. (B) Mean±s.e.m. DROSHA ChIP-seq signals of the 50 most cut AsiSI sites, over 20 kb windows and centered at the AsiSI site, are shown for cut (+4OHT, green), uncut (−4OHT, red) or mock (magenta) samples. (C) Coverage plot profile representing the read count per million mapped reads (RPM) of DROSHA ChIP-seq for cut (+4OHT, green) and uncut (−4OHT, red) samples at two representative AsiSI sites, DSB-I and DSB-II, among the most cut (Iannelli et al., 2017). Vertical lines in A–C indicate the boundaries of the region used to center all the top 50 AsiSI sites. (D,E) The bar plots show the percentage of ChIP enrichment, relative to the input, of mock (no antibody) and of γH2AX (D) or DROSHA (E) as detected by ChIP-qPCR in cut (+4OHT) and uncut (−4OHT) DIvA cells treated with control siRNA (siCTRL), and in cut DIvA cells knocked down for DROSHA (siDRO +4OHT), with primers targeting DSB-I, DSB-II or an unrelated genomic region far from any annotated AsiSI sites. Data are mean±s.e.m. from three independent experiments. **P≤0.01; ****P≤0.0001 (two-way ANOVA with Tukey's multiple comparison test). (F) Mean±s.e.m. DROSHA ChIP-seq signals of eight AsiSI sites positioned in regions annotated either as a promoter, genic or intergenic region, over 20 kb windows and centered at the AsiSI site, are shown for cut (+4OHT, green), uncut (−4OHT, red) or mock (magenta) samples. All the AsiSI sites assayed are included in a previously published set of most cut AsiSI sites (Iannelli et al., 2017). Vertical lines indicate the boundaries of the region used to center all the top 50 AsiSI sites. (G) DIvA cells were treated with CDK7 inhibitor (CDK7I) or mock treated with DMSO. Phosphorylation status of RNAP II was evaluated by western blotting. Pol IIo indicates hyperphosphorylated CTD, Pol IIa indicates unphosphorylated CTD. Vinculin was used as loading control. (H,I) The bar plots show the percentage of ChIP enrichment, relative to the input, of mock (no antibody) and of DROSHA (H) or γH2AX (I) as detected by ChIP-qPCR in cut (+4OHT) and uncut (−4OHT) DIvA cells mock treated with DMSO, and in cut DIvA cells treated with CDK7 inhibitor (CDK7i), with primers matching DSB-I, DSB-II or an unrelated genomic region far from any annotated AsiSI sites Data are mean±s.e.m. from three independent experiments. *P≤0.05; **P≤0.01; ***P≤0.001; ****P≤0.0001 (two-way ANOVA with Tukey's multiple comparison test).

