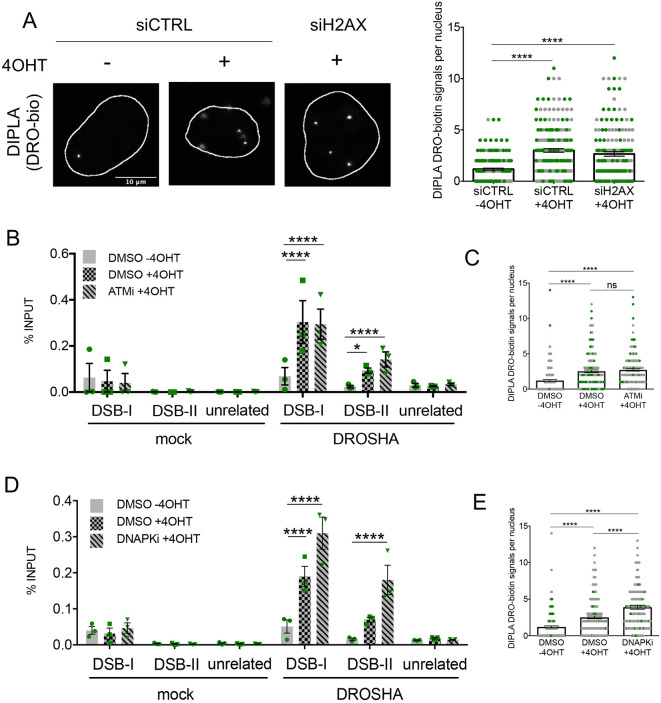
Fig. 2.
DROSHA recruitment at DNA damage sites occurs independently of DDR signaling activation. (A) Representative images of DI-PLA signal of DNA ends–DROSHA proximity in cut (+4OHT) and uncut (−4OHT) DIvA cells treated with control siRNA (siCTRL) and cut DIvA cells depleted of H2AX (siH2AX). The scatter plot represents the number of DI-PLA signals measured using CellProfiler automated software. Data are presented as mean±s.e.m. (200 cells, n=2). ****P≤0.0001 (one-way ANOVA with Tukey's multiple comparison test). (B) The bar plot shows the percentage of ChIP enrichment, relative to the input, of mock (no antibody) and DROSHA as detected by ChIP-qPCR in cut (+4OHT) and uncut (−4OHT) DIvA cells mock treated with DMSO and in cut DIvA cells treated with ATM inhibitor (ATMi), with primers matching DSB-I, DSB-II or an unrelated genomic region far from any annotated AsiSI sites. Data are mean±s.e.m. from three independent experiments. *P≤0.05; ****P≤0.0001 (two-way ANOVA with Tukey's multiple comparison test). (C) The scatter plot represents the number of DI-PLA signals measured using CellProfiler automated software in cut (+4OHT) and uncut (−4OHT) DIvA cells mock treated with DMSO and in cut DIvA cells treated with ATM inhibitor (ATMi). Data are presented as mean±s.e.m. (200 cells, n=2). ****P≤0.0001; ns, not significant (one-way ANOVA with Tukey's multiple comparison test). (D) The bar plot shows the percentage of ChIP enrichment, relative to the input, of mock (no antibody) and DROSHA as detected by ChIP-qPCR in cut (+4OHT) and uncut (−4OHT) DIvA cells mock treated with DMSO and in cut DIvA cells treated with DNA-PK inhibitor (DNA-PKi), with primers matching DSB-I, DSB-II or an unrelated genomic region far from any annotated AsiSI sites. Data are mean±s.e.m. from three independent experiments. ****P≤0.0001 (two-way ANOVA with Tukey's multiple comparison test). (E) The scatter plot represents the number of DI-PLA signals measured using CellProfiler automated software in cut (+4OHT) and uncut (−4OHT) DIvA cells mock treated with DMSO and in cut DIvA cells treated with DNA-PK inhibitor (DNA-PKi). Data are presented as mean±s.e.m. (200 cells, n=2). ****P≤0.0001 (one-way ANOVA with Tukey's multiple comparison test).

